. 2012;7(10):e48357.
doi: 10.1371/journal.pone.0048357. Epub 2012 Oct 31.

Neural correlates of true and false memory in mild cognitive impairment

Affiliations

Neural correlates of true and false memory in mild cognitive impairment

Catherine M Sweeney-Reed et al. PLoS One. 2012.

Abstract

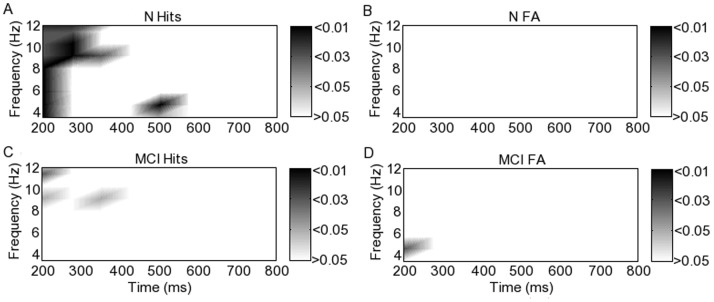
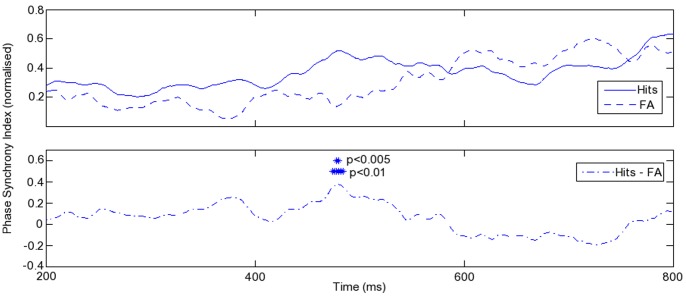
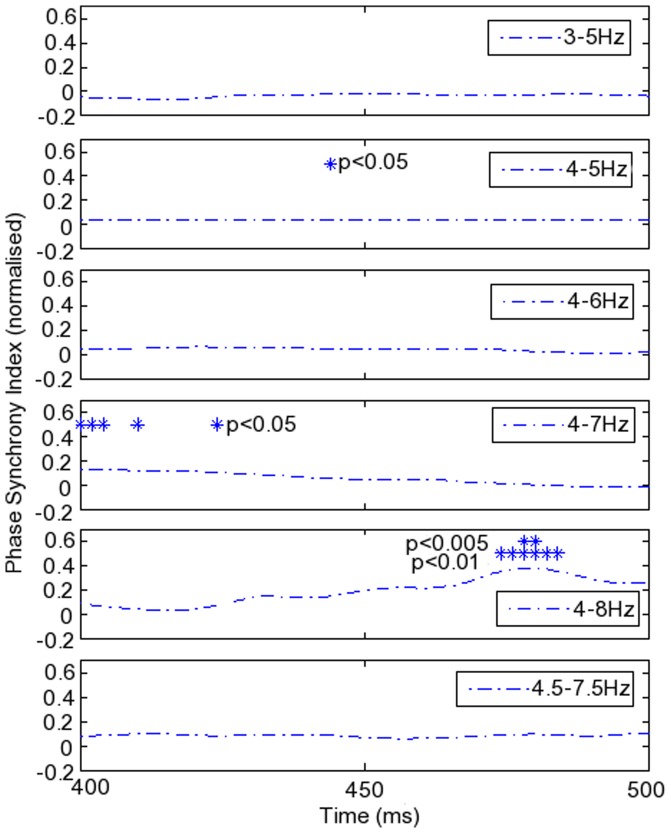
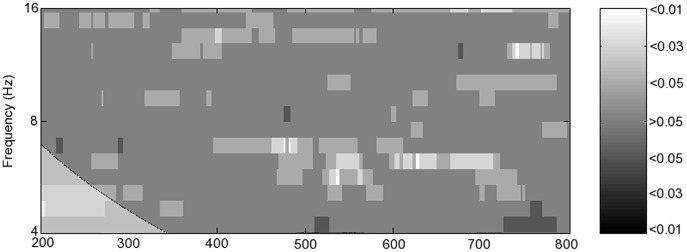
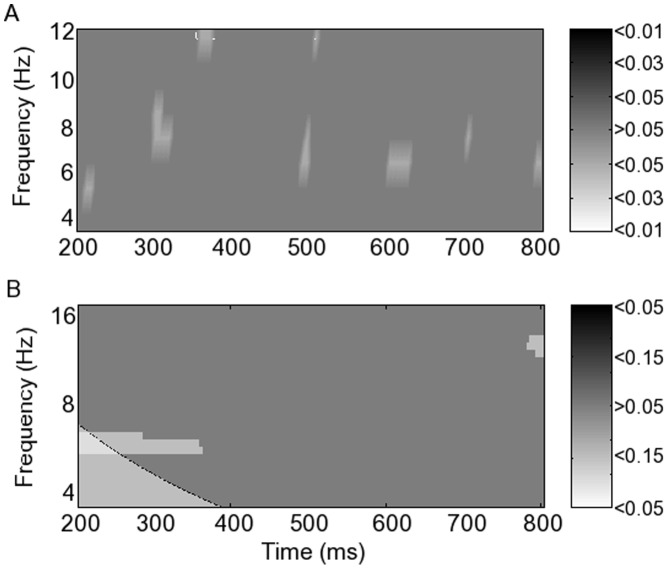
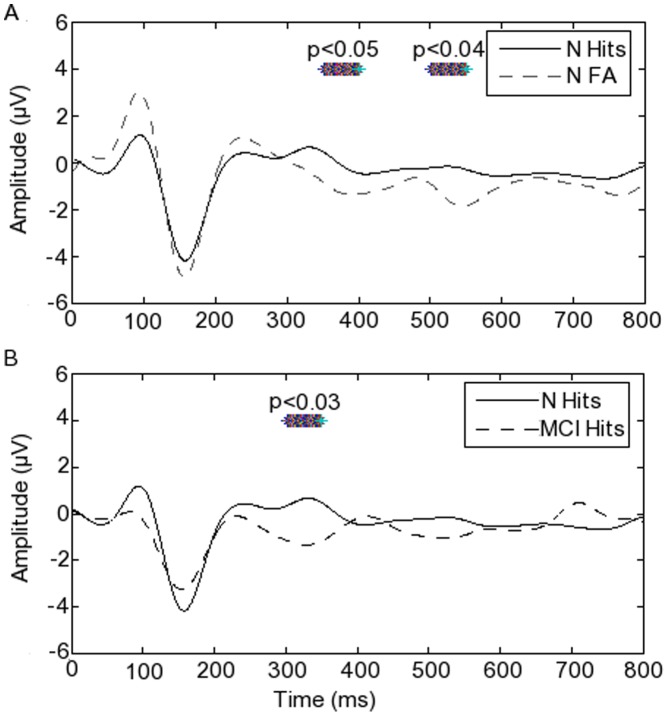
The goal of this research was to investigate the changes in neural processing in mild cognitive impairment. We measured phase synchrony, amplitudes, and event-related potentials in veridical and false memory to determine whether these differed in participants with mild cognitive impairment compared with typical, age-matched controls. Empirical mode decomposition phase locking analysis was used to assess synchrony, which is the first time this analysis technique has been applied in a complex cognitive task such as memory processing. The technique allowed assessment of changes in frontal and parietal cortex connectivity over time during a memory task, without a priori selection of frequency ranges, which has been shown previously to influence synchrony detection. Phase synchrony differed significantly in its timing and degree between participant groups in the theta and alpha frequency ranges. Timing differences suggested greater dependence on gist memory in the presence of mild cognitive impairment. The group with mild cognitive impairment had significantly more frontal theta phase locking than the controls in the absence of a significant behavioural difference in the task, providing new evidence for compensatory processing in the former group. Both groups showed greater frontal phase locking during false than true memory, suggesting increased searching when no actual memory trace was found. Significant inter-group differences in frontal alpha phase locking provided support for a role for lower and upper alpha oscillations in memory processing. Finally, fronto-parietal interaction was significantly reduced in the group with mild cognitive impairment, supporting the notion that mild cognitive impairment could represent an early stage in Alzheimer's disease, which has been described as a 'disconnection syndrome'.


Conflict of interest statement

Competing Interests: The authors have declared that no competing interests exist.

Figures

Figure 1
Figure 1. Behavioural paradigm.
Experimental protocol followed for the recording of EEG data during performance of the Deese-Roediger-MacDermott paradigm.
Figure 2
Figure 2. Spatial localisation of ERP and phase alignment differences between hits and FA in typical participants.
The right frontal and left parietal electrodes chosen for study are highlighted in the Electrical Geodesics Inc. Sensor Net used for recording EEG. A. ERP differences in the first 250 ms post-stimulus. B. ERP differences 400–650 ms post-stimulus. C. Mean theta phase alignment differences in the first 250 ms post-stimulus. D. Mean alpha phase alignment differences 150–400 ms post-stimulus. The colourbar represents p-values determined using a two-sample T-test.
Figure 3
Figure 3. Artefact removal.
Illustration of the removal of two blink artefacts using temporal decorrelation separation independent component analysis. A: the component which contained the blink artefacts for one trial. B: the data before and after removal of the latter component.
Figure 4
Figure 4. Phase locking differences between groups and condition, calculated using empirical mode decomposition phase locking analysis.
p-values corrected for multiple comparisons are shown using the greyscale. Zero represents no significant difference, the dark scale is for when the first named group and condition is significantly greater than the second, and the light scale is for when the second group/condition is significantly greater.
Figure 5
Figure 5. Fronto-parietal correlation between levels of phase locking calculated using empirical mode decomposition phase locking analysis.
p-values corrected for multiple comparisons are shown in greyscale for typical and mildly cognitively impaired groups during hits and false alarms.
Figure 6
Figure 6. Phase synchrony calculated following 4–8 Hz bandpass filtering during hits and FA in typical participants.
A. Single trial phase locking values (SPLVs) averaged over trials and subjects in hits and in false alarms (FA). B. The difference between SPLVs averaged across trials in hits versus FA. Asterisks indicate the time period in which the difference was found to be statistically significant.
Figure 7
Figure 7. Varying bandpass filter corner frequencies in the theta frequency range.
Differing frequency cut-offs were identified in the literature. Both the detection and the time localisation of significant differences in phase synchrony between conditions were affected by the a priori choice of bandpass filter corner frequencies. Note that the scale for the phase synchrony index is the same for each panel to facilitate direct comparison. As a result, the peak differences found in the second and fourth panels from the top are only to be seen by reference to the asterisks indicating the timing of a significant difference.
Figure 8
Figure 8. Phase locking differences between hits and FA in participants with MCI calculated following wavelet decomposition.
p-values corrected for multiple comparisons are shown using the grayscale. Zero represents no significant difference, the light scale is for hits > FA, and the dark scale is for FA > hits. The light grey area in the lower left corner of the upper panel represents the region lying in the so-called cone of influence, where edge effects occur, making results unreliable.
Figure 9
Figure 9. Difference between amplitudes calculated following empirical mode decomposition and wavelet decomposition.
p-values are shown for the 4th parietal electrode in hits vs. false alarms in the typical participant group. Zero represents no significant difference, the dark scale is for hits > false alarms, and the light scale is for false alarms > hits. The light grey area in the lower left corner of the upper panel represents the region lying in the so-called cone of influence, where edge effects occur, making results unreliable.
Figure 10
Figure 10. Left parietal event-related potentials differing between conditions and groups.
Asterisks mark the time during which there was a statistically significant difference between the event-related potentials shown, with the relevant p-values (uncorrected).

References

    1. Francis PT, Palmer AM, Snape M, Wilcock GK (1999) The cholinergic hypothesis of Alzheimer’s disease: a review of progress. J Neurol Neurosurg Psychiatry 66: 137–147. - PMC - PubMed
    1. Dauwels J, Vialatte F, Cichocki A (2010) Diagnosis of Alzheimer’s disease from EEG signals: Where are we Standing? Current Alzheimer Research 7: 487–505. - PubMed
    1. Mandzia J, Black S, Grady C, McAndrews MP, Graham S (2001) Encoding and retrieval in aging and memory loss. An fMRI study. Brain and Cognition 49: 225–228. - PubMed
    1. Zakanis KK, Boulos MI. A meta-analysis of ApoE genotype and neuropsychologic and neuroanatomic changes in preclinical Alzheimer’s Disease; 2002.
    1. Sherwin BB (2000) Mild cognitive impairment: potential pharmacological treatment options. Journal of the American Geriatrics Society 48: 431–441. - PubMed

Publication types