. 2012;7(10):e48593.
doi: 10.1371/journal.pone.0048593. Epub 2012 Oct 30.

CD69 does not affect the extent of T cell priming

Affiliations

CD69 does not affect the extent of T cell priming

Elisenda Alari-Pahissa et al. PLoS One. 2012.

Abstract

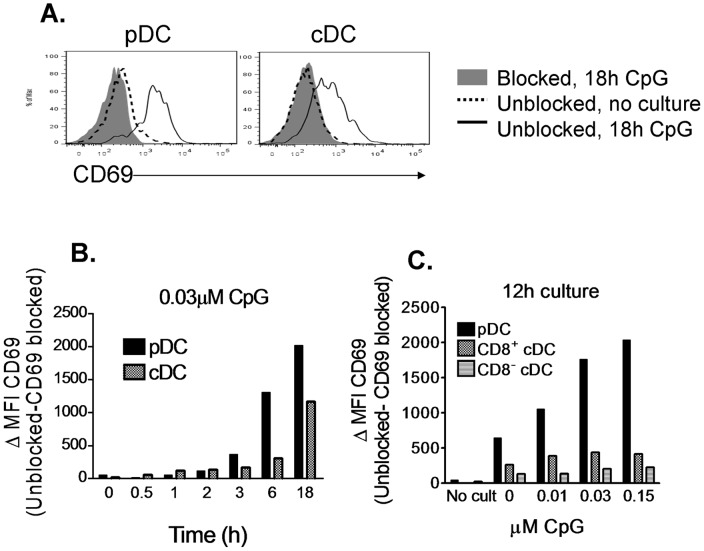
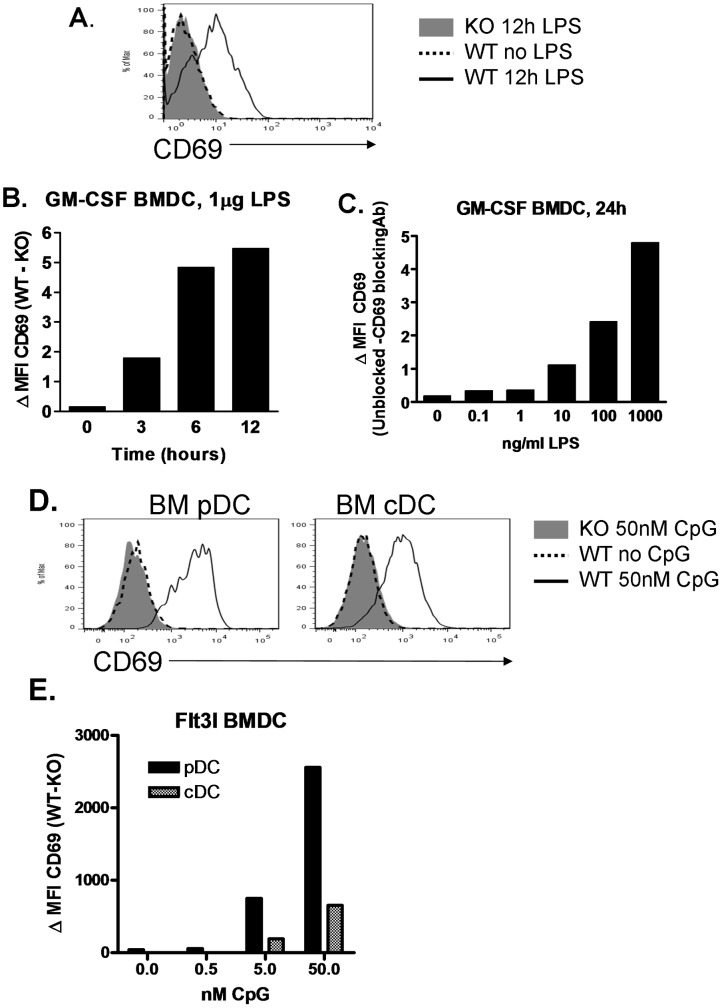
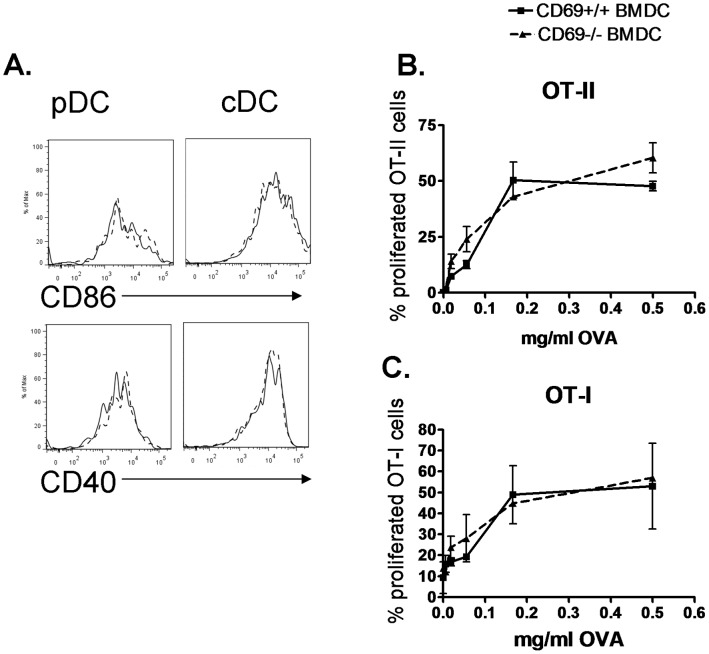
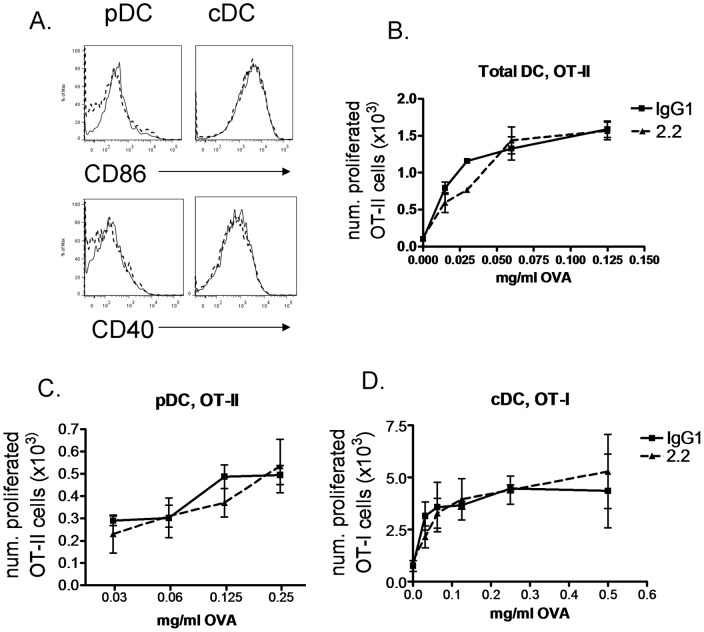
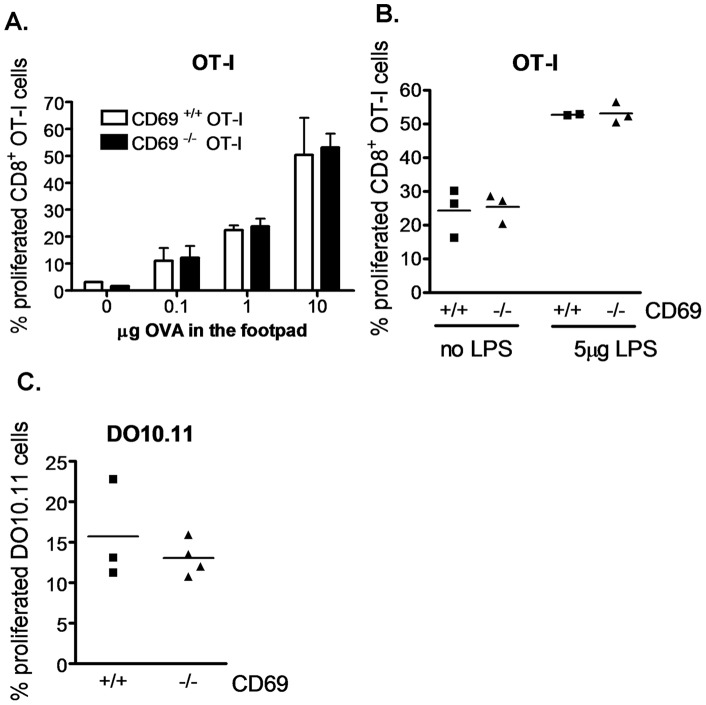
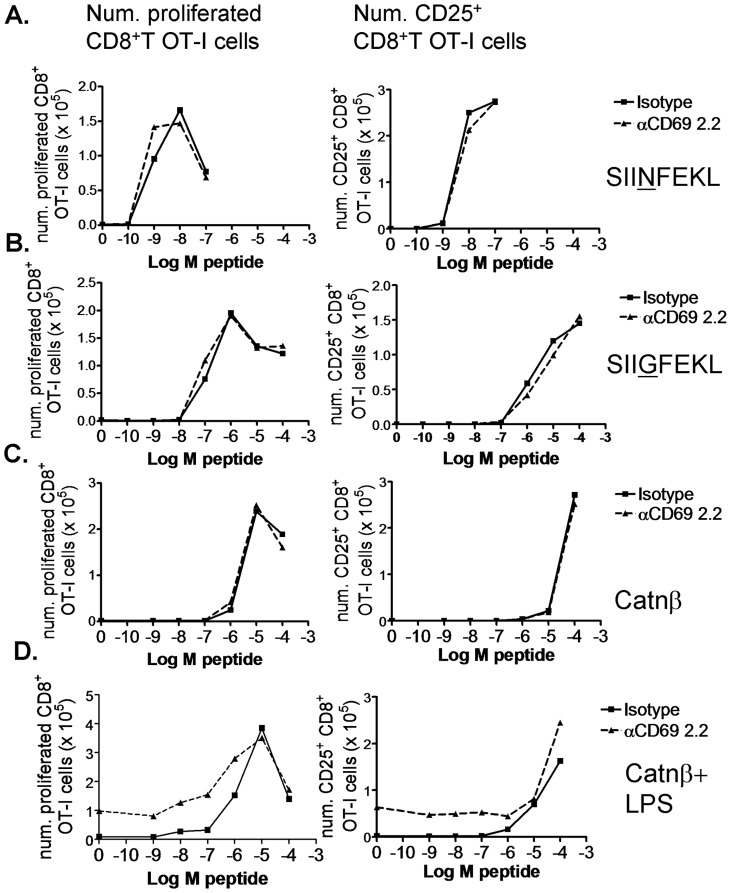
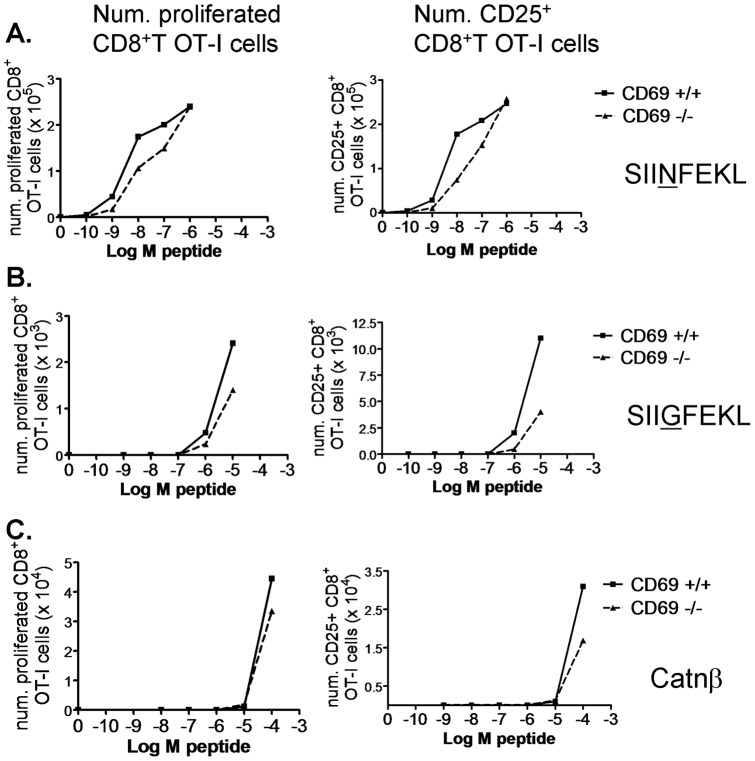
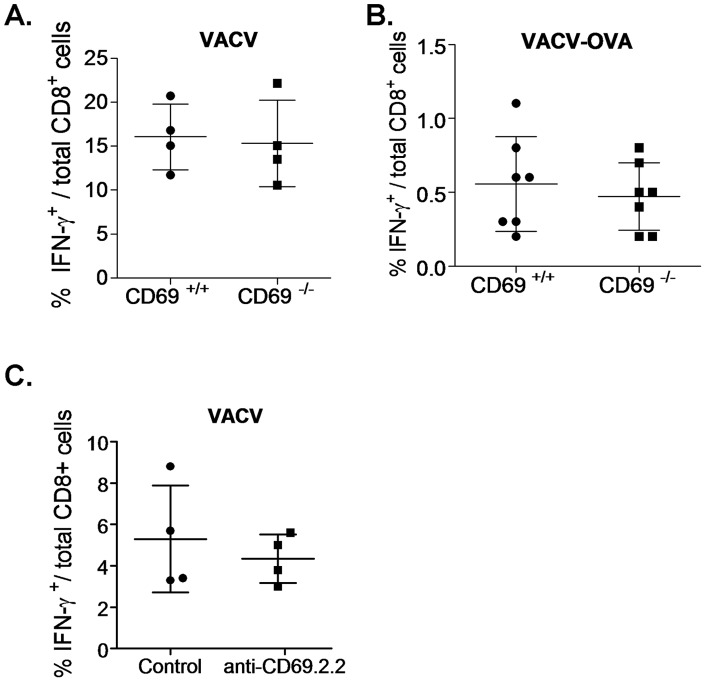
CD69 is rapidly upregulated on T cells upon activation. In this work we show that this is also the case for CD69 expression on dendritic cells (DC). Thus, the expression kinetics of CD69 on both cell types is reminiscent of the one of costimulatory molecules. Using mouse models of transgenic T cells, we aimed at evaluating the effect of monoclonal antibody (MAb)-based targeting and gene deficiency of CD69 expressed by either DC or T cells on the extent of antigen (Ag)-specific T cell priming, which could be the result of a putative role in costimulation as well as on DC maturation and Ag-processing and presentation. CD69 targeting or deficiency of DC did not affect their expression of costimulatory molecules nor their capacity to induce Ag-specific T cell proliferation in in vitro assays. Also, CD69 targeting or deficiency of transgenic T cells did not affect the minimal proliferative dose for different peptide agonists in vitro. In in vivo models of transgenic T cell transfer and local Ag injection, CD69 deficiency of transferred T cells did not affect the extent of the proliferative response in Ag-draining lymph nodes (LN). In agreement with these results, CD69 MAb targeting or gene deficiency of Vaccinia-virus (VACV) infected mice did not affect the endogenous formation of virus-specific CD8(+) T cell populations at the peak of the primary immune response. Altogether our results argue against a possible role in costimulation or an effect on Ag processing and presentation for CD69.


Conflict of interest statement

Competing Interests: The authors have declared that no competing interests exist.

Figures

Figure 1
Figure 1. CD69 is upregulated on endogenous DC upon activation.
A.–C. DC were purified from spleens of C57BL/6 mice and cultured with CpG in various conditions. 10 γg/ml of anti-CD69 2.2 were added to control samples in order to block CD69 staining and provide a background staining control. 10 µg/ml of Isotype control Ab were added to test samples. All samples were stained for the different DC subsets markers and for CD69, and analyzed by flow cytometry. A. Overlay of CD69 expression between CD69 blocked control samples cultured with 0.03 µM CpG for 18h (grey filled), and unblocked samples, uncultured (dashed line) or cultured with 0.03 µM CpG for 18h (solid line), gated on pDC (CD11cint, CD45RA+), and cDC (CD11chi, CD45RA). B. DC were cultured with 0.03 µM CpG during various time-spans and CD69 was assessed in pDC (CD11cint, CD45RA+) and cDC (CD11chi, CD45RA). C. pDC (CD11cint, CD45RA+), CD8+ cDC (CD11chi, CD45RA, CD8+) and CD8 cDC (CD11chi , CD45RA, CD8) were analyzed for CD69 expression after 12h culture with different doses of CpG or without having been cultured. In B and C, CD69 levels are expressed as the difference of CD69 MFI between the unblocked and blocked samples. Results representative of two similar experiments are shown.
Figure 2
Figure 2. CD69 is upregulated on BMDC upon activation.
CD69+/+ or CD69−/− GM-CSF BMDC were treated with LPS at different conditions of time and dose. Subsequently they were stained for CD11c and CD69, and analyzed by flow cytometry. A. Overlay of CD69 histograms of CD69+/+ untreated cells (dashed line), and CD69–/− (grey filled) and CD69+/+ (solid line) cells cultured for 12h with 1 µg/ml of LPS (right). B. Time course of CD69 upregulation in response to 1 µg/ml of LPS. CD69 expression is the difference in MFI between CD69+/+ and CD69−/− BMDC. C. CD69+/+ BMDC were cultured for 24h with growing doses of LPS and with anti-CD69 2.2 (to provide a background staining control) or Isotype control. CD69 surface expression is expressed as the difference in MFI between unblocked and blocked samples. Results are representative of two experiments with similar results. D. and E. CD69+/+ or CD69−/− Flt3l-derived BMDC were treated with various CpG doses for 24h and stained for the different DC subset markers and CD69. D. Overlay of the CD69 histograms of 50nM CpG-treated CD69−/− (grey filled), and untreated (dashed line) or 50nM CpG-treated (black line) CD69+/+ pDC (CD11c+, CD45RA+, left) and cDC (CD11c+, CD45RA, right). E. CD69+/+ and CD69−/− BMDC were cultured with growing doses of CpG for 24h. CD69 surface levels are expressed as the difference in MFI between CD69+/+ and CD69−/− BMDC. The results shown are of one out of two similar experiments.
Figure 3
Figure 3. CD69 deficient DC do not have altered priming capacity.
A. CD69+/+ or CD69−/− Flt3l-derived BMDC were cultured with 0.5 µM CpG for 24 h. Overlays of CD69+/+ (solid line) and CD69−/− (dashed line) Flt3l-derived BMDC showing CD86 and CD40 expression on pDC (CD11c+, CD45RA+, left) and cDC (CD11c+, CD45RA, right). B. and C. CD69+/+ or CD69−/− Flt3l-derived BMDC were pulsed with OVA at the indicated doses for 45 minutes, washed, and further cultured with OT-II (B.) or OT-I (C.) T cells for 3 or 2 days, respectively, in the presence of 0.5 µM CpG in duplicate. Percentage of proliferated Vα2+ CD4+ or Vα2+ CD8+ cells is depicted. Bars represent Standard Deviation (SD) of duplicate cultures. Experiments representative of two with similar results.
Figure 4
Figure 4. CD69 targeting on DC does not alter their costimulation and priming capacity.
A. Flt3l BMDC were cultured with 50 nM CpG and anti-CD69 2.2 (solid line) or IgG1 control (dashed line) for 24 h. CD86 and CD40 expression levels were determined on pDC (CD11c+, CD45RA+, left) and cDC (CD11c+, CD45RA, right). Result representative of two experiments. B. Purified DC were cultured with OT-II CD4+ T cells, in the presence of the indicated OVA doses, 0.03 µM CpG and 10 µg/ml anti-CD69 2.2 or IgG1 isotype control, in duplicate, for 3 days. C. Sorted pDC were cultured with the indicated OVA doses and 10 µg/ml anti-CD69 2.2 or IgG1 isotype control for 1 h. After wash, they were co-cultured with CD4+ OT-II T cells for 3 days. D. Sorted cDC were pulsed with the indicated OVA doses for 45 minutes and treated with 0.025 µM CpG and anti-CD69 2.2 or IgG1 control for 18 h. Then, they were cultured with OT-I CD8+ T cells for 2 days. In all cases, the number of divided cells within Vα2+ CD8+ or Vα2+ CD4+ live cells is represented. Bars represent SD of duplicate cultures.
Figure 5
Figure 5. CD69 deficiency on T cells does not affect Ag-specific T cell proliferation in Ag-draining LN.
A. Purified CD69+/+ or CD69−/− OT-I CD8+ T cells were CFSE stained and transferred into recipients receiving the indicated doses of OVA and 5 µg of LPS subcutaneously in a posterior footpad. The percentage of proliferated OT-I CD8+ T cells was analyzed 42h later in the popliteal LN. Pool of two experiments, with 1 (dose 0) to 4 (doses 0.1–10 µg) mice per point. Bars represent SD. B. As in A, but mice received 10 µg of OVA with or without 5 µg of LPS in the footpad. C. Purified CD69+/+ or CD69−/− RAG2−/− DO10.11 CD4+ T cells were transferred into Balb/c mice receiving 1 µg of OVA subcutaneously in the footpad. 3 days later the popliteal LN were analyzed for the percentage of proliferated cells within DO10.11 CD4+ T cells.
Figure 6
Figure 6. CD69 targeting does not alter CD8+ T cell priming threshold at different peptide agonistic affinities.
Whole LN and spleen OT-I RAG1−/− cells were stained with 2 µM CFSE and cultured at 106 cells per well with the indicated doses of SIINFEKL (A), SIIGFEKL (B), Catnβ1 (C) and Catnβ1 plus 1 µg/ml of LPS (D), and 10 µg/ml of anti-CD69 2.2 mAb (dashed line) or isotype control (solid line). Graphs showing the number of proliferated (left column) and of CD25+ (right column) CD8+ T cells per well. Results representative of two experiments.
Figure 7
Figure 7. CD69 deficiency does not alter CD8+ T cell priming threshold at different peptide agonistic affinities.
Spleen CD8+ T cells were purified from CD69+/+ (solid line) or CD69−/− (dashed line) OT-I mice, stained with 2 µM CFSE and cultured at 0.5×10⁶ at 10∶1 with APC in the presence of the indicated doses of SIINFEKL (A), SIIGFEKL (B), and Catnβ1 (C) peptides. Graphs showing the number of proliferated (left column) and of CD25+ (right column) CD8+ T cells per well. The results are representative of two similar experiments with similar results.
Figure 8
Figure 8. CD69 does not affect the primary formation of Vaccinia virus-specific CD8+ T cell populations.
A. CD69+/+ or CD69−/− mice were infected with VACV-WR and 7 days later spleen cells were reestimulated with uninfected (background control) or VACV-WR-infected RMA cells. B. CD69+/+ or CD69−/− mice were infected with VACV-OVA and 7 days later spleen cells were reestimulated with or without (background control) SIINFEKL peptide. Pool of two experiments. C. H-2 class I knockout HLA-A*0201-transgenic mice were i.v. treated with 100 µg of anti-CD69 2.2 or left untreated, and were subsequently infected with VACV-WR. After 7 days, spleen cells were reestimulated with uninfected (background control) or VACV-WR-infected HLA-A*0201 transfectant RMA cells. In all cases, cells were stained for intracellular IFNγ, and the percentage of IFNγ+ CD8+ T cells within total cells was assessed. The background control values were substracted from each reestimulated sample value.

References

    1. Ziegler SF, Ramsdell F, Alderson MR (1994) The activation antigen CD69. Stem Cells 12: 456–465. - PubMed
    1. Ziegler SF, Levin SD, Johnson L, Copeland NG, Gilbert DJ, et al. (1994) The mouse CD69 gene. Structure, expression, and mapping to the NK gene complex. J Immunol 152: 1228–1236. - PubMed
    1. Feng H, Zhang D, Palliser D, Zhu P, Cai S, et al. (2005) Listeria-infected myeloid dendritic cells produce IFN-beta, priming T cell activation. J Immunol 175: 421–432. - PubMed
    1. Testi R, Phillips JH, Lanier LL (1989) T cell activation via Leu-23 (CD69). J Immunol 143: 1123–1128. - PubMed
    1. Rasmussen AM, Blomhoff HK, Stokke T, Horejsi V, Smeland EB (1994) Cross-linking of CD53 promotes activation of resting human B lymphocytes. J Immunol 153: 4997–5007. - PubMed

Publication types

MeSH terms