

Towards improvements in the estimation of the coalescent: implications for the most effective use of Y chromosome short tandem repeat mutation rates
- PMID: 23119076
- PMCID: PMC3485328
- DOI: 10.1371/journal.pone.0048638
Towards improvements in the estimation of the coalescent: implications for the most effective use of Y chromosome short tandem repeat mutation rates
Abstract
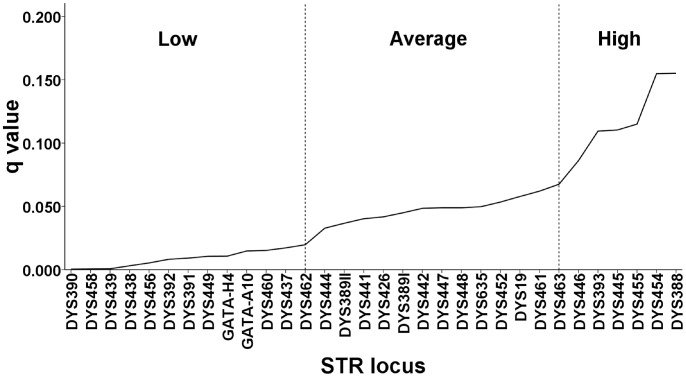
Over the past two decades, many short tandem repeat (STR) microsatellite loci on the human Y chromosome have been identified together with mutation rate estimates for the individual loci. These have been used to estimate the coalescent age, or the time to the most recent common ancestor (TMRCA) expressed in generations, in conjunction with the average square difference measure (ASD), an unbiased point estimator of TMRCA based upon the average within-locus allele variance between haplotypes. The ASD estimator, in turn, depends on accurate mutation rate estimates to be able to produce good approximations of the coalescent age of a sample. Here, a comparison is made between three published sets of per locus mutation rate estimates as they are applied to the calculation of the coalescent age for real and simulated population samples. A novel evaluation method is developed for estimating the degree of conformity of any Y chromosome STR locus of interest to the strict stepwise mutation model and specific recommendations are made regarding the suitability of thirty-two commonly used Y-STR loci for the purpose of estimating the coalescent. The use of the geometric mean for averaging ASD and û across loci is shown to improve the consistency of the resulting estimates, with decreased sensitivity to outliers and to the number of STR loci compared or the particular set of mutation rates selected.
Conflict of interest statement
Figures
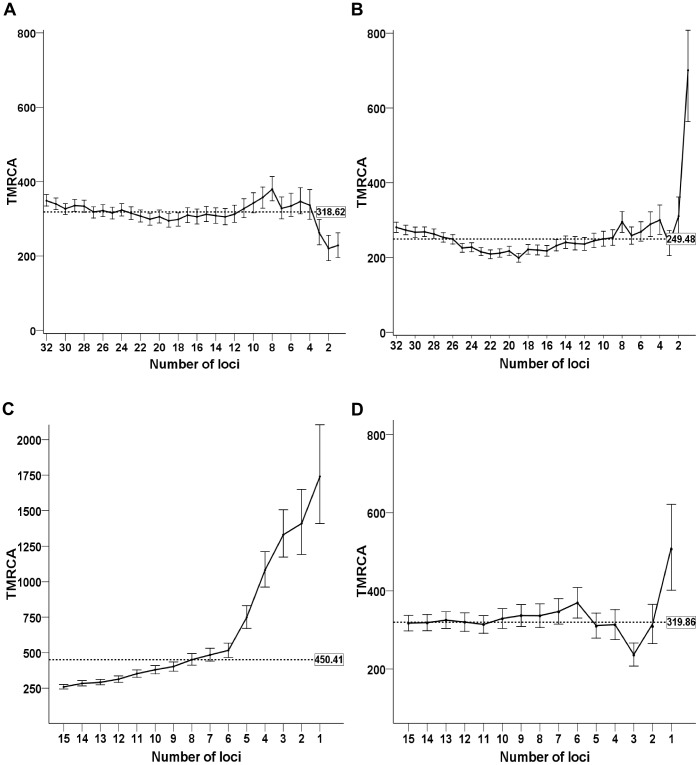
 value for each comparison, shown in the box at the right end of the dashed line.
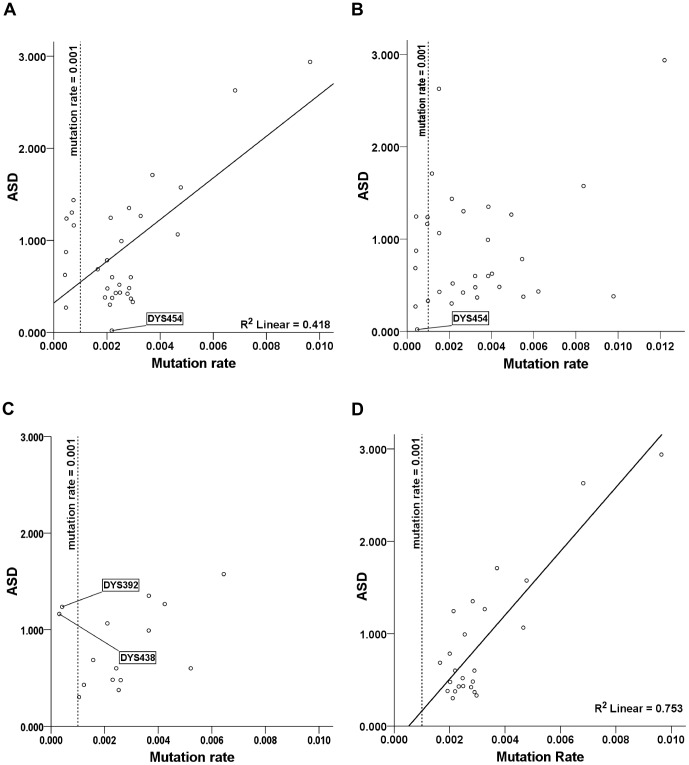
 0.001 removed from the calculation. Data set compared is from the “British Isles DNA Project,” n = 245, 32 locus haplotypes and subsets of the same data set (24 locus reduced set and 15 locus set corresponding to the YHRD ssSTR loci.).
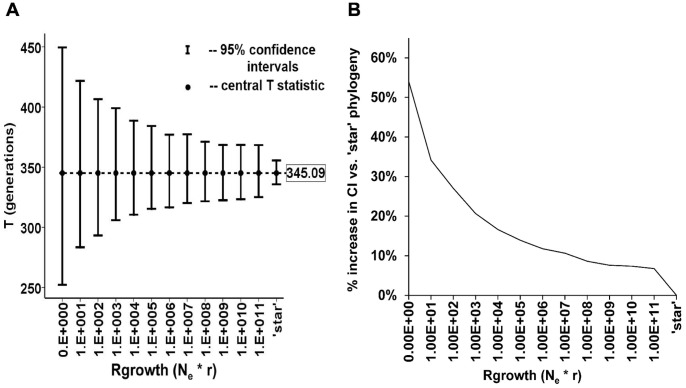
 and 95% confidence intervals plotted for the STR data set (n = 245, 32 loci) as the Rgrowth (Ne*r) parameter is varied between Rgrowth = 0 (no growth, constant sized population) to a “star” genealogy (approximating infinite exponential growth by all descendant lines) by orders of magnitude from 1.0E+1 to 1.0E+11.
  = 345.09 was the median value for all Rgrowth models and was shown empirically to be independent of the shape of the sampled genealogy, growth rate and population size. B) Percentage change of 95% CI overestimation compared to ‘star’ genealogy for the full range of comparisons in 4A.
Similar articles
-
Twelve short tandem repeat loci Y chromosome haplotypes: genetic analysis on populations residing in North America.Forensic Sci Int. 2005 May 28;150(1):1-15. doi: 10.1016/j.forsciint.2005.01.010. Forensic Sci Int. 2005. PMID: 15837004
-
Bimodal allele frequency distribution at Y-STR loci DYS392 and DYS438: no evidence for a deviation from the stepwise mutation model.Int J Legal Med. 2003 Oct;117(5):287-90. doi: 10.1007/s00414-003-0388-1. Epub 2003 Jul 12. Int J Legal Med. 2003. PMID: 12861418
-
The effective mutation rate at Y chromosome short tandem repeats, with application to human population-divergence time.Am J Hum Genet. 2004 Jan;74(1):50-61. doi: 10.1086/380911. Epub 2003 Dec 19. Am J Hum Genet. 2004. PMID: 14691732 Free PMC article.
-
Toward a consensus on SNP and STR mutation rates on the human Y-chromosome.Hum Genet. 2017 May;136(5):575-590. doi: 10.1007/s00439-017-1805-8. Epub 2017 Apr 28. Hum Genet. 2017. PMID: 28455625 Review.
-
Genetics and genomics of core short tandem repeat loci used in human identity testing.J Forensic Sci. 2006 Mar;51(2):253-65. doi: 10.1111/j.1556-4029.2006.00046.x. J Forensic Sci. 2006. PMID: 16566758 Review.
Cited by
-
Low historical rates of cuckoldry in a Western European human population traced by Y-chromosome and genealogical data.Proc Biol Sci. 2013 Dec 7;280(1772):20132400. doi: 10.1098/rspb.2013.2400. Proc Biol Sci. 2013. PMID: 24266034 Free PMC article.
-
Challenges in analysis and interpretation of microsatellite data for population genetic studies.Ecol Evol. 2014 Nov;4(22):4399-428. doi: 10.1002/ece3.1305. Epub 2014 Oct 30. Ecol Evol. 2014. PMID: 25540699 Free PMC article. Review.
-
Improved Models of Coalescence Ages of Y-DNA Haplogroups.Genes (Basel). 2021 Jun 4;12(6):862. doi: 10.3390/genes12060862. Genes (Basel). 2021. PMID: 34200049 Free PMC article.
References
-
- Jobling MA, Tyler-Smith C (2003) The human Y chromosome: an evolutionary marker comes of age. Nat Rev Genet 4: 598–612. - PubMed
-
- Ohta T, Kimura M (1973) A model of mutation appropriate to estimate the number of electrophoretically detectable alleles in a finite population. Genet Res 22: 201–204. - PubMed
MeSH terms
LinkOut - more resources
Full Text Sources
Miscellaneous
