. 2012 Jul-Aug;278(1-2):103-12.
doi: 10.1016/j.cellimm.2012.07.005. Epub 2012 Aug 4.

In vivo imaging implicates CCR2(+) monocytes as regulators of neutrophil recruitment during arthritis

Affiliations

In vivo imaging implicates CCR2(+) monocytes as regulators of neutrophil recruitment during arthritis

Baomei Wang et al. Cell Immunol. 2012 Jul-Aug.

Abstract

The infiltration of neutrophils and monocytes is a prominent feature of inflammatory diseases including human rheumatoid arthritis. Understanding how neutrophil recruitment is regulated during pathogenesis is crucial for developing anti-inflammatory therapies. We optimized the K/B×N serum-induced mouse arthritis model to study neutrophil trafficking dynamics in vivo using two-photon microscopy. Arthritogenic serum was injected subcutaneously into one hind footpad to induce a local arthritis with robust neutrophil recruitment. Using this approach, we showed that the depletion of monocytes with clodronate liposomes impaired neutrophil recruitment specifically at the transendothelial migration step. The depletion of CCR2(+) monocytes with the monoclonal antibody MC-21 reproduced these effects, implicating CCR2(+) monocytes as key regulators of neutrophil extravasation during arthritis initiation. However, monocyte depletion did not prevent neutrophil extravasation in response to bacterial challenge. These findings suggest that anti-inflammatory therapies targeting monocytes may act in part through antagonizing neutrophil extravasation at sites of aseptic inflammation.


Figures

Fig. 1
Fig. 1
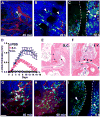
The accelerated serum transfer arthritis mouse model recapitulates important features of the i.v. K/B×N serum transfer model. (A-C) The recruitment of neutrophils (green) at the indicated time points in the paw of LysM-GFP mice. (A) 45 min after serum transfer, neutrophils (arrowhead) arrest within vessels (red). (B) 20 h, extravascular neutrophils (arrowheads) migrate through the collagen rich interstitium (blue). (C) 72 h, neutrophils form dynamic clusters near the joint (arrowheads). The dotted lines indicate the joint space based on the second harmonic generation signal. n = 7, (Scale bar = 40 μm). (D) Arthritis development in i.v. versus s.c. serum transfer models. Arthritis was evaluated by measuring an increase in ankle thickness. Data are expressed as the mean change in ankle thickness ± SD; n = 8. (E) Representative hematoxylin-eosin staining of a tarsal joint. Leukocyte influx within joint synovium is indicated (asterisk). In addition, a focal area of bone resorption is visible (open arrows), n = 3. (F)The loss of chondrocytes and cartilage matrix is apparent (closed arrows), as well as multifocal areas of cartilage ulceration (asterisks) with fibrovascular (pannus) invasion of the bone marrow space (open arrows), n = 3. (G–I) Neutrophil (green) recruitment in the paw of LysM-GFP mice after s.c. serum transfer. (G) 40 min after serum transfer, neutrophils (arrowhead) arrest within vessels (red). (H) 60 min, neutrophils migrate away from extravasation sites through interstitial tissue. (I) 6 h, neutrophils cluster near the joint (arrowheads), n = 8. (Scale bar = 40 μm).
Fig. 2
Fig. 2
Neutrophil trafficking behavior in the paw of LysM-GFP mice after s.c. K/BxN serum transfer. Time-lapse images show, (A) the recruitment and migration dynamics of neutrophils. Representative cell tracks with indicated cell positions (arrowheads), n = 8. (Scale bar = 40 μm). Time stamps show relative time in min:sec. (B) Representative extravascular neutrophil tracks imaged 45–75 min after serum injection. The plot is an overlay of 49 individual neutrophil tracks normalized to their starting positions. Tracks from three independent experiments are shown in different colors. (C) Meandering index and (D) median track velocity are plotted for data in (B). Flow cytometric analysis of freshly disaggregated joint myeloid cells (E) gated on CD11b +cells and assessed for Ly6G+ neutrophils at 2 h (T= 2) after s.c. serum injection and (F) gated on CD11b+ and CD115+ to assess the infiltration of Ly6Chigh vs. Ly6Clow monocytes.
Fig. 3
Fig. 3
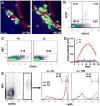
CL-mediated monocyte depletion prevents K/B×N serum induced arthritis. (A) Co-localization of Q-dot+ cells (red, indicated by white arrowhead) with neutrophils (green). The magenta arrowheads indicate sites of neutrophil extravasation. Scale bar = 20 μm, n = 5. Time stamps show relative time in min:sec. (B) 45 min post injection of 655-nm nontargeted Q-dots, Q-dot+ cells in peripheral blood are predominantly CD115+ monocytes, n = 5. (C) Circulating monocyte numbers after daily i.v. CL-treatment (initial dose of 200 μl followed by 100 μl) assessed by flow cytometry. Peripheral blood cells were stained with CD115 (clone AFS98) and appropriate isotype control (BD PharMingen), n = 5. (D) The effect of CL-treatment in the aSTA model. Mice were pretreated with i.v. CL or PL and then challenged s.c. with K/B×N serum. CL-treatment fully blocked serum induced ankle swelling. Data are expressed as mean change in ankle thickness ± SD, n = 7. (E) 18 h after serum injection, foodpads were harvested, digested and single cell suspensions stained with antibodies to CD11b and Ly6C. CL-treatment reduced the recruitment of Ly6C high monocytes, but not Ly6C low monocytes.
Fig. 4
Fig. 4
CL-treatment inhibits neutrophil extravasation during arthritis. (A) Time-lapse 2P images were acquired 40 min after serum transfer. Neutrophils (green) arrested along the vessel (red), but displayed impaired extravasation and disrupted chemotaxis in parenchymal tissues. Representative cell tracks are shown and cell positions indicated (arrowheads), n = 5. (Scale bar = 40 μm). Time stamps show relative time in min:sec. (B) The percentage of intravascular neutrophils in CL and PL-treated mice after serum transfer. Time-lapse videos were captured beginning 40 min after s.c. serum transfer and the percentage of intravascular neutrophils that co-localized with blood vessels was analyzed using Volocity software, n = 5. (C) Representative tracks of extravascular neutrophils in CL-treated (left panel) and control PL-treated mice (right panel) imaged 45–75 min after serum injection. Plots show an overlay of 36 individual neutrophil tracks normalized to their starting positions. Tracks from three independent experiments are shown in different colors. (D) Meandering index and (E) median track velocity of neutrophils from CL-treated (open square) and PL-treated (open triangle) mice are plotted for tracks in (C). (F) Neutrophil trafficking behaviors in i.v. CL-pretreated mice 30–50 min after s.c. Lm challenge. Representative cell tracks are shown and cell positions indicated (arrowheads). Time stamps show relative time in min:sec, n = 5. (Scale bar = 40 μm). (G) The meandering index and (H) the median track velocity of neutrophils from CL-treated (open square) and PL-treated (open triangle) mice are plotted, n = 5.
Fig. 5
Fig. 5
CX3CR1-GFPcell trafficking behavior in the steady-state and after s.c. serum transfer. (A) Intravascular behavior of CX3CR1-GFP cells (green) in the steady-state and(B) 40 min after serum transfer. Representative cell tracks are shown and cell positions indicated (arrowheads), n = 8. (Scale bar = 40 μm). The median track velocity of CX3CR1-GFP cells inside the vessel was 5.996 ± 2.07 μm/min. (C) Day 5 after serum transfer, CX3CR1-GFP cells localized near the joint (arrows). Dotted lines indicate the joint space based on the second harmonic generation signal, n = 5. (Scale bar = 40 μm). (D) Arthritis development in Cx3cr1gfp/gfp and control mice and (E) after treatment with blocking antibody to CX3CR1 or isotype matched control antibody. Mice were injected with 50 μl of K/B×N serum s.c. and ankle thickness was measured daily. Data are expressed as the mean change in ankle thickness ± SD, n = 6. (F) Anti-CX3CR1 blocking antibody did not inhibit neutrophil (green) intravascular arrest and (G) extravascular trafficking after s.c. serum transfer. Representative cell tracks are shown and cell positions indicated (arrowheads). Time stamps show relative time in min:sec, n = 5. (Scale bar = 40 μm).
Fig. 6
Fig. 6
MC-21 monoclonal antibody treatment impairs neutrophil extravasation and subsequent chemotaxis. Mice were pretreated with either MC-21 monoclonal antibody or isotype control antibody (Iso). (A) Time-lapse images were recorded in LysM-GFP mice 40 min after serum injection. Neutrophils (green) displayed impaired extravasation (asterisks) from blood vessels (outlined by magenta dotted lines) and reduced directional migration away from vessels. Representative cell tracks are shown and cell positions indicated (white arrowheads). Cell clusters near sites of extravasation are indicated by yellow arrowheads, n = 5. (Scale bar = 40 m). Time stamps show relative time in min:sec. (B) Representative tracks of extravascular neutrophils in the tissue of mice treated with MC-21 or control antibody imaged 45–75 min after serum injection. An overlay of 36 individual neutrophil tracks normalized to their starting positions. Tracks from three independent experiments are displayed in different colors. (C) Meandering index and (D) median track velocity of neutrophils from MC-21-treated (open square) and isotype control-treated (open triangle) mice are plotted for tracks in (B). (E and F) Neutrophil recruitment and trafficking to Lm challenge is not inhibited by MC-21-pretreatment. Mice were imaged 45 min after challenge. Representative cell tracks are shown and cell positions indicated (arrowheads). Scale bar = 40 m, n = 5. (G) Meandering index and (H) median track velocity of neutrophils from MC-21-treated (open square) and isotype control-treated (open triangle) mice are plotted, n = 5.

References

    1. Feldmann M, Brennan FM, Maini RN. Rheumatoid Arthritis. Cell. 1996;85:307–310. - PubMed
    1. Norberg B, Eriksson S. Joint fluid leukocytosis of patients with rheumatoid arthritis evidence for neutrophil and monocyte chemotaxis in vivo. Clin Rheumatol. 1983;2:237–242. - PubMed
    1. Ley K, Laudanna C, Cybulsky MI, Nourshargh S. Getting to the site of inflammation: the leukocyte adhesion cascade updated. Nat Rev Immunol. 2007;7:678–689. - PubMed
    1. Chou RC, Kim ND, Sadik CD, Seung E, Lan Y, Byrne MH, et al. Lipid–cytokine–chemokine cascade drives neutrophil recruitment in a murine model of inflammatory arthritis. Immunity. 2010;33:266–278. - PMC - PubMed
    1. Edwards SW, Hallett MB. Seeing the wood for the trees: the forgotten role of neutrophils in rheumatoid arthritis. Immunol Today. 1997;18:320–324. - PubMed

Publication types

MeSH terms

LinkOut - more resources