

Statistical analysis of longitudinal neuroimage data with Linear Mixed Effects models
- PMID: 23123680
- PMCID: PMC3586747
- DOI: 10.1016/j.neuroimage.2012.10.065
Statistical analysis of longitudinal neuroimage data with Linear Mixed Effects models
Erratum in
- Neuroimage. 2015 Mar;108:110
Abstract
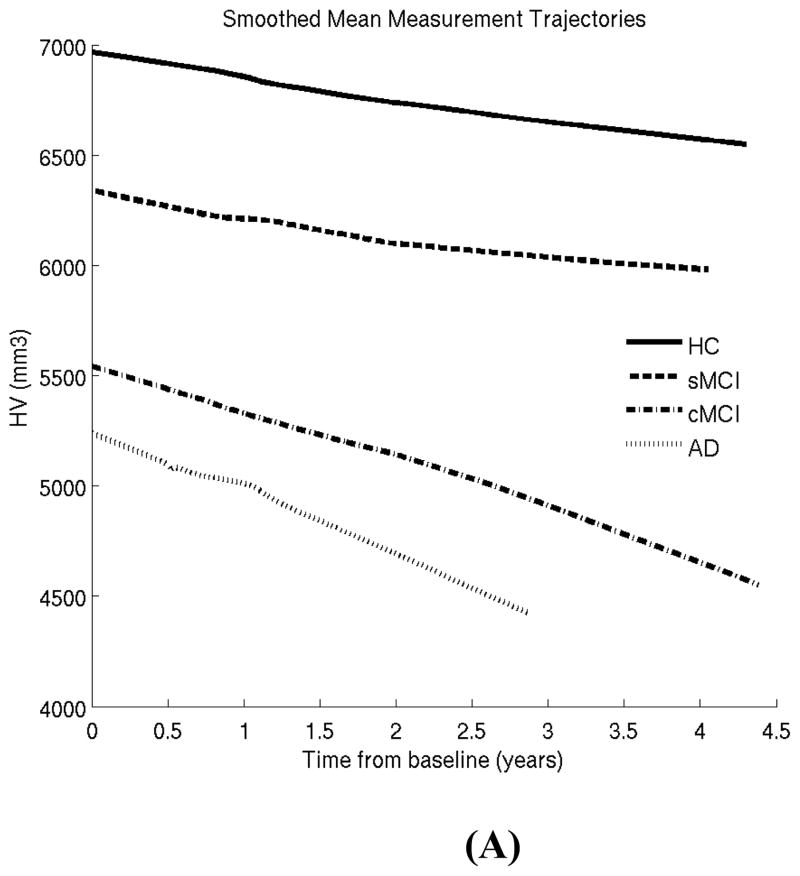
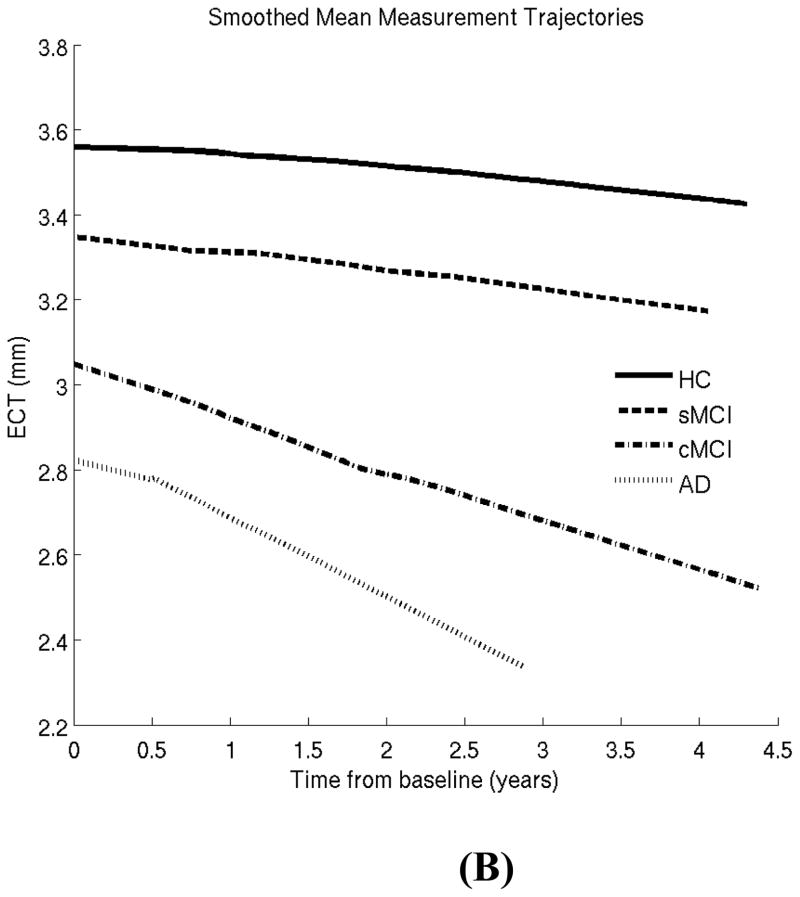
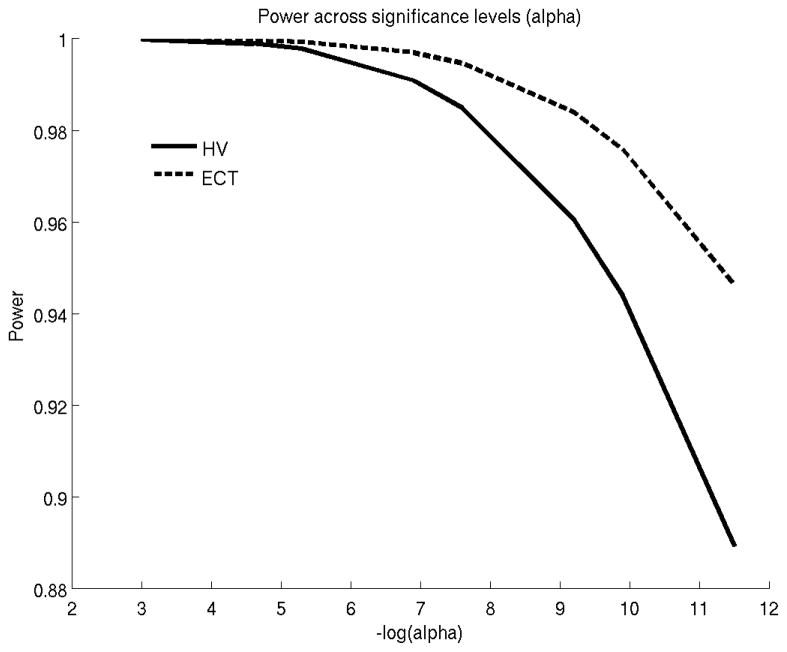
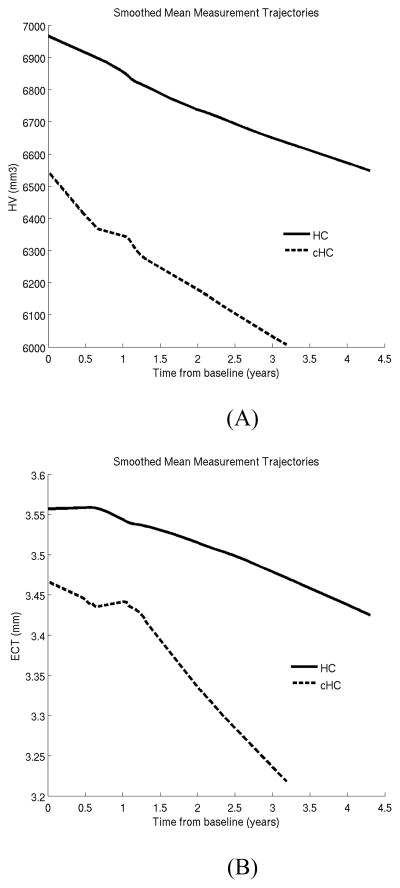
Longitudinal neuroimaging (LNI) studies are rapidly becoming more prevalent and growing in size. Today, no standardized computational tools exist for the analysis of LNI data and widely used methods are sub-optimal for the types of data encountered in real-life studies. Linear Mixed Effects (LME) modeling, a mature approach well known in the statistics community, offers a powerful and versatile framework for analyzing real-life LNI data. This article presents the theory behind LME models, contrasts it with other popular approaches in the context of LNI, and is accompanied with an array of computational tools that will be made freely available through FreeSurfer - a popular Magnetic Resonance Image (MRI) analysis software package. Our core contribution is to provide a quantitative empirical evaluation of the performance of LME and competing alternatives popularly used in prior longitudinal structural MRI studies, namely repeated measures ANOVA and the analysis of annualized longitudinal change measures (e.g. atrophy rate). In our experiments, we analyzed MRI-derived longitudinal hippocampal volume and entorhinal cortex thickness measurements from a public dataset consisting of Alzheimer's patients, subjects with mild cognitive impairment and healthy controls. Our results suggest that the LME approach offers superior statistical power in detecting longitudinal group differences.
Keywords: Linear Mixed Effects models; Longitudinal studies; Statistical analysis.
Copyright © 2012 Elsevier Inc. All rights reserved.
Figures
References
-
- Blockx I, Van Camp N, Verhoye M, Boisgard R, Dubois A, Jego B, Jonckers E, Raber K, Siquier K, Kuhnast B, Dolle F, Nguyen HP, Von Horsten S, Tavitian B, Van der Linden A. Genotype specific age related changes in a transgenic rat model of Huntington’s disease. Neuroimage. 2011;58:1006–1016. - PubMed
-
- Buckner RL, Head D, Parker J, Fotenos AF, Marcus D, Morris JC, Snyder AZ. A unified approach for morphometric and functional data analysis in young, old, and demented adults using automated atlas-based head size normalization: reliability and validation against manual measurement of total intracranial volume. NeuroImage. 2004;23:724–738. - PubMed
-
- Chetelat G, Landeau B, Eustache F, Mezenge F, Viader F, de La Sayette V, Desgranges B, Baron JC. Using voxel-based morphometry to map the structural changes associated with rapid conversion in MCI: a longitudinal MRI study. Neuroimage. 2005;27:934–946. - PubMed
Publication types
MeSH terms
Grants and funding
- P01 NS058793/NS/NINDS NIH HHS/United States
- R01EB006758/EB/NIBIB NIH HHS/United States
- R01 NS052585-01/NS/NINDS NIH HHS/United States
- U01 AG024904/AG/NIA NIH HHS/United States
- S10 RR019307/RR/NCRR NIH HHS/United States
- R01 NS052585/NS/NINDS NIH HHS/United States
- 1K25EB013649-01/EB/NIBIB NIH HHS/United States
- R01 AG016495/AG/NIA NIH HHS/United States
- 1S10RR023401/RR/NCRR NIH HHS/United States
- S10 RR023043/RR/NCRR NIH HHS/United States
- RC1 AT005728-01/AT/NCCIH NIH HHS/United States
- R01 EB006758/EB/NIBIB NIH HHS/United States
- R01 AG022381/AG/NIA NIH HHS/United States
- U01 MH093765/MH/NIMH NIH HHS/United States
- R01 NS070963/NS/NINDS NIH HHS/United States
- P41-RR14075/RR/NCRR NIH HHS/United States
- K25 EB013649/EB/NIBIB NIH HHS/United States
- R01 HD071664/HD/NICHD NIH HHS/United States
- R01-HD071664/HD/NICHD NIH HHS/United States
- P41 RR014075/RR/NCRR NIH HHS/United States
- 5P01NS058793-03/NS/NINDS NIH HHS/United States
- 1KL2RR025757-01/RR/NCRR NIH HHS/United States
- AG022381/AG/NIA NIH HHS/United States
- R01 AG008122/AG/NIA NIH HHS/United States
- R01 NS042861/NS/NINDS NIH HHS/United States
- 2R01NS042861-06A1/NS/NINDS NIH HHS/United States
- 1S10RR019307/RR/NCRR NIH HHS/United States
- 1S10RR023043/RR/NCRR NIH HHS/United States
- 5R01AG008122-22/AG/NIA NIH HHS/United States
- 1R21NS072652-01/NS/NINDS NIH HHS/United States
- RC1 AT005728/AT/NCCIH NIH HHS/United States
- 1R01NS070963/NS/NINDS NIH HHS/United States
- 5U01-MH093765/MH/NIMH NIH HHS/United States
- R21 NS072652/NS/NINDS NIH HHS/United States
- KL2 RR025757/RR/NCRR NIH HHS/United States
- S10 RR023401/RR/NCRR NIH HHS/United States
LinkOut - more resources
Full Text Sources
Other Literature Sources
Medical
