. 2012 Nov 15;491(7424):473-7.
doi: 10.1038/nature11626. Epub 2012 Oct 31.

Endothelial cell expression of haemoglobin α regulates nitric oxide signalling

Affiliations

Endothelial cell expression of haemoglobin α regulates nitric oxide signalling

Adam C Straub et al. Nature. .

Abstract

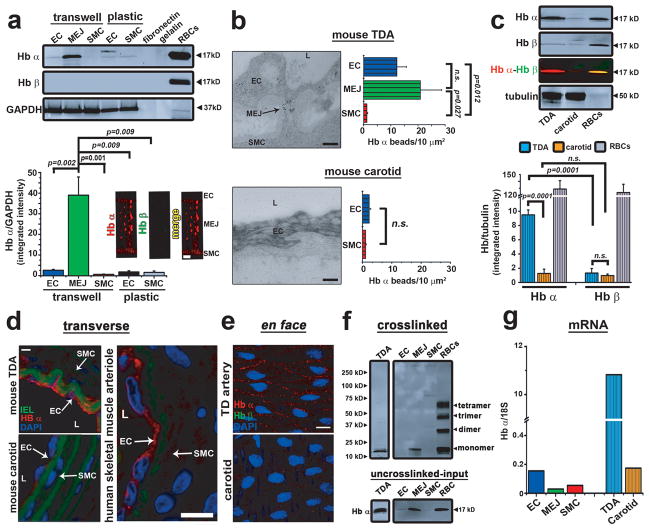
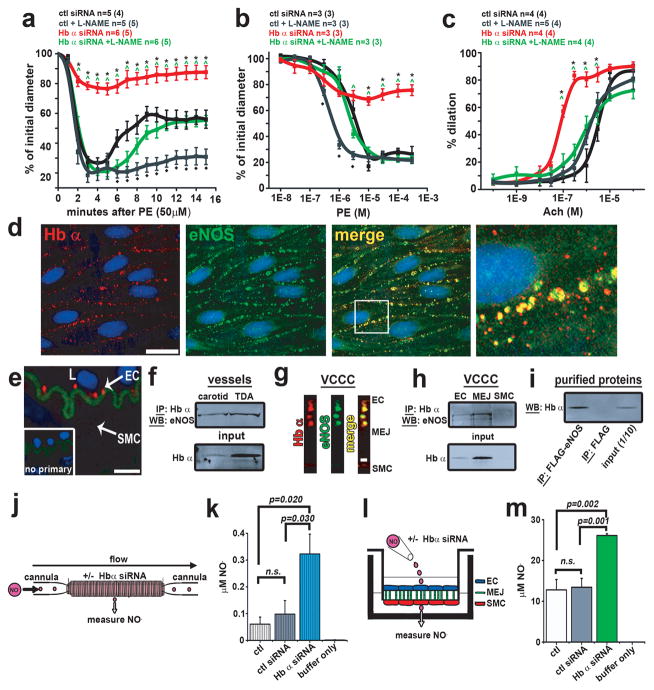
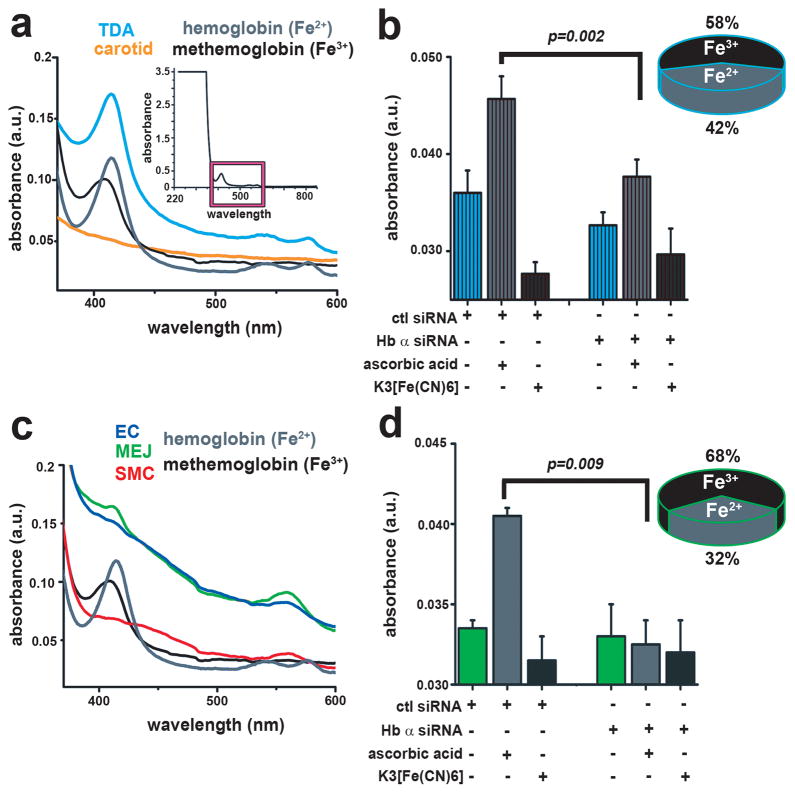
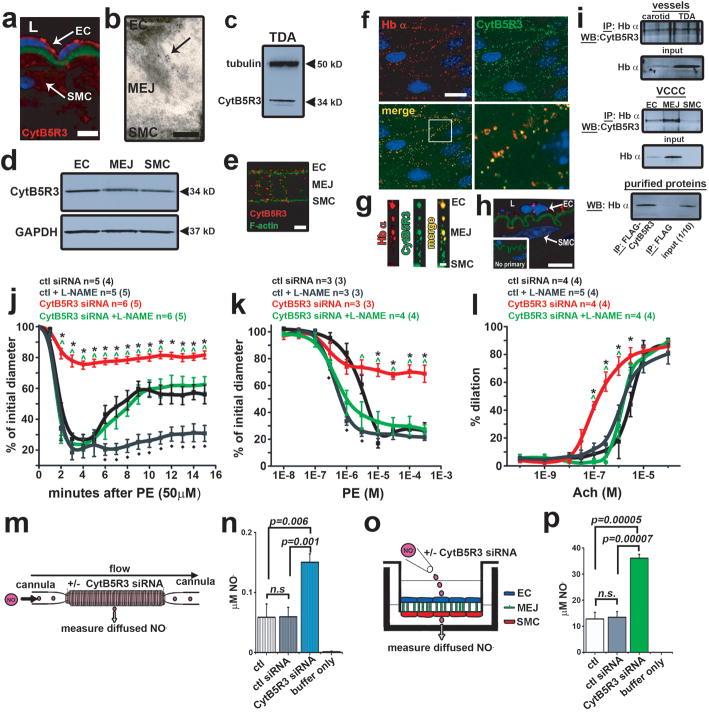
Models of unregulated nitric oxide (NO) diffusion do not consistently account for the biochemistry of NO synthase (NOS)-dependent signalling in many cell systems. For example, endothelial NOS controls blood pressure, blood flow and oxygen delivery through its effect on vascular smooth muscle tone, but the regulation of these processes is not adequately explained by simple NO diffusion from endothelium to smooth muscle. Here we report a new model for the regulation of NO signalling by demonstrating that haemoglobin (Hb) α (encoded by the HBA1 and HBA2 genes in humans) is expressed in human and mouse arterial endothelial cells and enriched at the myoendothelial junction, where it regulates the effects of NO on vascular reactivity. Notably, this function is unique to Hb α and is abrogated by its genetic depletion. Mechanistically, endothelial Hb α haem iron in the Fe(3+) state permits NO signalling, and this signalling is shut off when Hb α is reduced to the Fe(2+) state by endothelial cytochrome b5 reductase 3 (CYB5R3, also known as diaphorase 1). Genetic and pharmacological inhibition of CYB5R3 increases NO bioactivity in small arteries. These data reveal a new mechanism by which the regulation of the intracellular Hb α oxidation state controls NOS signalling in non-erythroid cells. This model may be relevant to haem-containing globins in a broad range of NOS-containing somatic cells.


Conflict of interest statement

Competing financial interest

None

Figures

Figure 1
Figure 1. Monomeric Hb α is expressed in ECs and enriched at the MEJ
a, Quantitative Western blot analysis for Hb α and Hb β expression in coronary EC, MEJ or SMC lysates from cells plated on Transwells or plastic (n≥4), or in fibronectin and gelatin used to coat Transwells. Red blood cells served as a positive control and GAPDH was used as loading and normalization control for quantitation (bottom left). Immunofluorescence for Hb α (red) and Hb β (green) (bottom right). b, TEM analysis of Hb α expression in TD (top) or carotid (bottom) arteries visualized using 10 nm gold beads (black particles). Arrow indicates MEJ. Graphs on the right represent Hb α localization calculated by measuring the number of beads per μm2 (n≥7). c, Quantitative Western blot analysis for Hb α and Hb β expression in isolated TD or carotid arteries. Tubulin served as a loading control and red blood cells were used as a positive control (n≥3). d, Immunofluorescence of transverse sections from mouse carotid or TD arteries or from a human skeletal muscle arteriole. In all images, red indicates Hb α expression, green shows internal elastic lamina autofluorescence, and blue specifies nuclei. e, En face images of Hb α (red) and Hb β (green) expression in ECs from TD or carotid arteries. Blue staining represents nuclei. f, Western blot analysis of TD artery, EC, MEJ, SMC or red blood cell lysates that were chemically crosslinked using BS3 to determine quaternary structure of Hb α. g, mRNA analysis from EC, MEJ and SMC lysates isolated from VCCC, TD and carotid arteries. 18S was used as a normalization factor. In a, b, c, and g open bars represent in vitro data and striped bars indicate ex vivo data. Scale bar in a is 2 μm, b is 0.5 μm, d indicates 30 μm (TD artery and carotid) or 10 μm (human skeletal muscle artery) and e signifies 10 μm. L is lumen (b, d) and n.s. indicates not significant (b, c)p values are shown for each comparison. All error bars represent s.e.m.
Figure 2
Figure 2. Hb α regulates vessel tone, NO diffusion and associates with eNOS
a, Time course to 50 μM PE, b dose response to PE and c dose response to Ach on TD arteries treated with control or Hb α siRNA in the presence or absence of L-NAME. In a–c, n indicates the number of arteries; value in parenthesis shows number of mice. d, En face view of a dual immunofluorescence of a mouse TD artery showing Hb α (red) and eNOS (green). The white box in the merge panel indicates the region of interest magnified in the right panel. e, Proximity ligation assay for Hb α and eNOS (red punctates) in transverse mouse TD artery sections. Inset shows the negative control. f, Western blot analysis from samples co-immunoprecipitated for Hb α and blotted for eNOS from isolated TD and carotid arteries. g, Dual immunofluorescence for Hb α and eNOS on transverse section from a VCCC. Red indicates Hb α and green shows eNOS. h, Co-immunoprecpitation of Hb α Western blotted for eNOS on VCCC lysates. i, Co-immunoprecpitation of purified eNOS-FLAG protein blotted for Hb α. j, Schematic diagram of experimental design illustrating a cannulated vessel transfected with Hb α siRNA showing NO diffusion as a readout. k, NO diffusion results from mouse TD arteries transfected with control or Hb α siRNA (n≥5). l, Illustration of experimental setup for VCCC experiments. m, NO diffusion results from VCCCs transfected with control or Hb α siRNA. (n≥4). In k striped bars represent ex vivo data and in m open bars indicate in vitro data. In a–c, * shows significance between control siRNA vs. Hb α siRNA, ^ indicates significance between Hb α siRNA vs. Hb α siRNA + L-NAME and ◆ represents significance between control vs. control + L-NAME. In d–e scale bar is 10 μm and in g 1 μm. In k and m n.s indicates not significant. In e, L indicates the lumenp values are shown for each comparison. All error bars represent s.e.m.
Figure 3
Figure 3. The oxidation state of Hb α resides in a mixture of Fe 2+ and Fe3+
a, Ultraviolet-visible spectroscopy analysis of TD arteries and c VCCC fractions. The inset in a indicates the region of interest (magenta box) of the Soret (~420 nm) and Q bands (~540575 nm). b, measurement of Hb α oxidation state calculating the ratio of Fe2+ to Fe3+ in TD arteries (n=3) and d VCCC fractions (n=3) with and without Hb α siRNA. In b striped bars indicate ex vivo data and in d open bars represent in vitro datap values are indicated for each comparison. All error bars represent s.e.m.
Figure 4
Figure 4. CytB5R3 expression and activity are critical for vasomotor tone and NO diffusion
a, Immunofluorescence of CytB5R3 expression (red) and nuclei (blue). Green represents autofluorescence from internal elastic lamina. b, TEM analysis of CytB5R3 expression at the MEJ (black particles) in vivo. c, Western blot analysis of CytB5R3 in TD arteries and d inVCCC. e, Immunofluorescence of CytB5R3 expression in the VCCC. Red shows CytB5R3 and green indicates F-actin. f, En face view of a dual immunofluorescence labeling of a mouse TD artery showing Hb α (red) and CytB5R3 (green) in upper panels. White box in the merge image in the lower left panel shows the region of interest magnified in the lower right panel. g, Colocalization of CytB5R3 (red) and Hb α (green) on a transverse section from the VCCC. h, Proximity ligation assay for Hb α and CytB5R3 (red punctates) on transverse mouse TD artery sections. Inset shows the negative control. Green shows internal elastic lamina autofluorescence. i, Western blot analysis from samples co-immunoprecipitated for Hb α and blotted for CytB5R3 from isolated TD and carotid arteries, VCCC or purified proteins. j, Time course to 50 μM PE, k dose response to PE and l dose response to Ach on TD arteries treated with control or Hb α siRNA in the presence or absence of L-NAME. In j–l, n indicates the number of arteries; value in parenthesis shows number of mice. m, Schematic of experimental setup for NO diffusion assay in a cannulated artery that was transfected with CytB5R3 siRNA. n, Results from NO diffusion experiment in mouse TD arteries with genetic knockdown of CytB5R3 expression (n≥3). o, Illustration showing the experimental setup for VCCC experiments. p, NO diffusion results from VCCCs transfected with control or CytB5R3 siRNA (n=4). In n striped bars indicate ex vivo data and in p open bars represent in vitro data. In j–l * shows significance between control siRNA vs. CytB5R3 siRNA, ^ indicates significance between CytB5R3 siRNA and CytB5R3 siRNA + L-NAME and ◆ represents significance between control vs. control + L-NAME. a, Scale bar is 10 μm, b is 0.25 μm, e is 5 μm, f, h are 10 μm and g is 1 μm. In a and h, L indicates lumenp values are indicated for each comparison. All error bars represent s.e.m.

Comment in

References

    1. Lim KH, Ancrile BB, Kashatus DF, Counter CM. Tumour maintenance is mediated by eNOS. Nature. 2008;452:646–649. doi: 10.1038/nature06778. nature06778 [pii] - DOI - PMC - PubMed
    1. Hess DT, Matsumoto A, Kim SO, Marshall HE, Stamler JS. Protein S-nitrosylation: purview and parameters. Nat Rev Mol Cell Biol. 2005;6:150–166. doi: 10.1038/nrm1569. nrm1569 [pii] - DOI - PubMed
    1. Bolotina VM, Najibi S, Palacino JJ, Pagano PJ, Cohen RA. Nitric oxide directly activates calcium-dependent potassium channels in vascular smooth muscle. Nature. 1994;368:850–853. doi: 10.1038/368850a0. - DOI - PubMed
    1. Shesely EG, et al. Elevated blood pressures in mice lacking endothelial nitric oxide synthase. Proc Natl Acad Sci U S A. 1996;93:13176–13181. - PMC - PubMed
    1. Straub AC, et al. Compartmentalized connexin 43 s-nitrosylation/denitrosylation regulates heterocellular communication in the vessel wall. Arterioscler Thromb Vasc Biol. 2011;31:399–407. doi: 10.1161/ATVBAHA.110.215939. ATVBAHA.110.215939 [pii] - DOI - PMC - PubMed

Publication types

MeSH terms