Randomized Controlled Trial
. 2013 Jan;79(2):497-507.
doi: 10.1128/AEM.02359-12. Epub 2012 Nov 2.

Bifidobacterial succession and correlation networks in a large unselected cohort of mothers and their children

Affiliations
Randomized Controlled Trial

Bifidobacterial succession and correlation networks in a large unselected cohort of mothers and their children

E Avershina et al. Appl Environ Microbiol. 2013 Jan.

Abstract

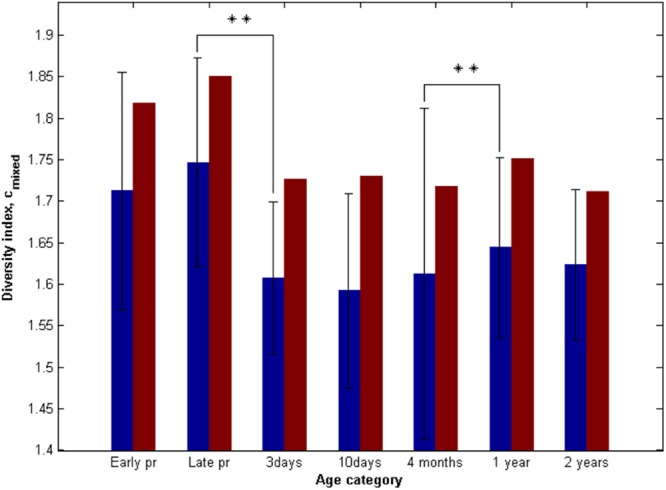
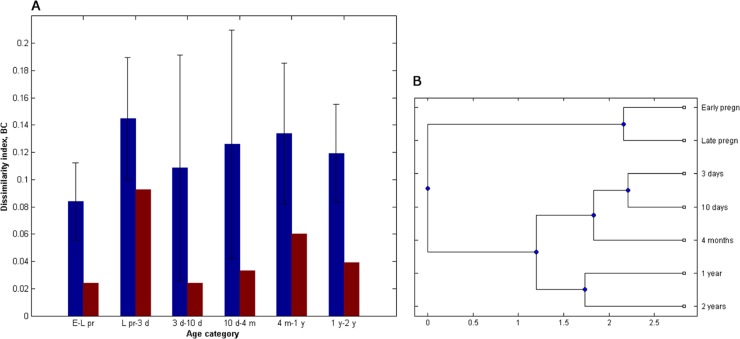
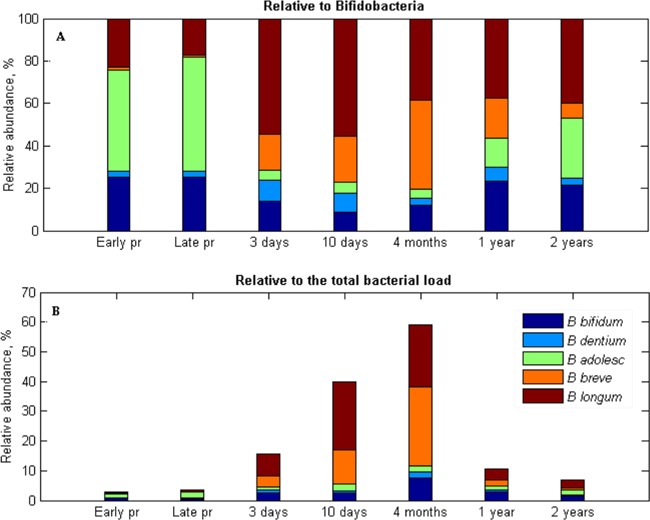
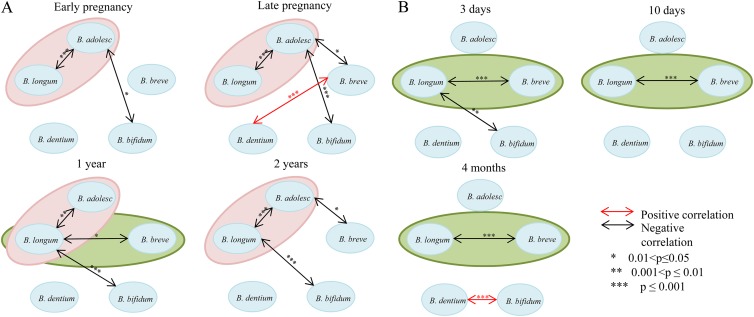
Bifidobacteria are a major microbial component of infant gut microbiota, which is believed to promote health benefits for the host and stimulate maturation of the immune system. Despite their perceived importance, very little is known about the natural development of and possible correlations between bifidobacteria in human populations. To address this knowledge gap, we analyzed stool samples from a randomly selected healthy cohort of 87 infants and their mothers with >90% of vaginal delivery and nearly 100% breast-feeding at 4 months. Fecal material was sampled during pregnancy, at 3 and 10 days, at 4 months, and at 1 and 2 years after birth. Stool samples were predicted to be rich in the species Bifidobacterium adolescentis, B. bifidum, B. dentium, B. breve, and B. longum. Due to high variation, we did not identify a clear age-related structure at the individual level. Within the population as a whole, however, there were clear age-related successions. Negative correlations between the B. longum group and B. adolescentis were detected in adults and in 1- and 2-year-old children, whereas negative correlations between B. longum and B. breve were characteristic for newborns and 4-month-old infants. The highly structured age-related development of and correlation networks between bifidobacterial species during the first 2 years of life mirrors their different or competing nutritional requirements, which in turn may be associated with specific biological functions in the development of healthy gut.


Figures

Fig 1
Fig 1
Flow diagram of the study. Boxes and circles represent processes and the data or materials obtained from them, respectively. At first, generated mixed spectra were trimmed to ensure that each spectrum brings an equal amount of information into the system. Then these spectra were analyzed using principal component analysis (PCA), evolving factor analysis (EFA), and multivariate curve resolution analysis with alternating least squares (MCR-ALS) to identify and quantify common bifidobacterial species in the data set. Quantification was performed relative to both the Bifidobacterium group and the total bacterial load. The B. longum group was resolved separately. Diversity was assessed using both taxon-based (UniFrac analysis based on MCR-ALS predictions) and taxon-independent (based on mixed spectra) techniques. The co-occurrence of various bifidobacteria, as well as their persistence over time, was also evaluated. Also, bifidobacteria were isolated from stool samples, and MLST analysis of several isolates was performed.
Fig 2
Fig 2
Simplified scheme of mixed sequence analysis. (A) Alignment of mixed sequences. All sequences have the same start and end, as well as a variable region in the middle. (B) MCR-ALS. Pure spectra common for all (the majority of) samples and their relative amounts in each sample are identified. (C) Base calling of pure MCR-ALS-resolved spectra. The nucleotide sequence of each of the pure resolved spectra is identified.
Fig 3
Fig 3
Modified Simpson's index of nucleotide spectra diversity cmixed at various ages. Early pr and Late pr, early (8 to 20 weeks) and late (30 to 40 weeks) pregnancy periods, respectively. Blue bars represent the average nucleotide diversity for individuals with the standard deviation as shown, whereas red bars represent the diversity of the average nucleotide intensity spectra for each age category. The significance in difference between diversity indexes at two subsequent time points was calculated with the Friedman's test. **, P < 0.01.
Fig 4
Fig 4
Comparison of mixed sequence spectra. (A) Modified Bray-Curtis index of nucleotide similarity (BC) between the subsequent time points. E-L pr, period between early (8 to 20 weeks) and late (30 to 40 weeks) pregnancy periods; L pr-3 d, comparison between 3-day-old newborns and their mothers during the late pregnancy stage; 3 d-10 d, comparison between 3 and 10 days of age; 10 d-4 m, comparison between 10 days and 4 months of age; 4 m-1 y, comparison between 4 months and 1 year of age; 1 y-2 y, comparison between 1 and 2 years of age. Blue bars represent the average similarity indices of nucleotide intensity spectra within every individual (with the standard deviation as shown), whereas red bars represent the similarity indices between the average nucleotide intensity spectra for each age category. (B) Clustering of the average nucleotide intensity spectra.
Fig 5
Fig 5
Bifidobacterium species composition in stool samples of infants (from 3 days to 2 years of age) and their mothers during pregnancy (pr) based on the results of MCR-ALS analysis relative to the bifidobacteria group (A) and relative to the total bacterial load (B).
Fig 6
Fig 6
Co-occurrence of five dominant bifidobacterial species. Ellipses represent correlations, detected more than in two various ages. Pink ellipses, correlations detected between B. adolescentis and B. longum group; green ellipses, correlations detected between B. longum group and B. breve. (A) Mothers during early (8 to 20 weeks) and late (30 to 40 weeks) pregnancy stages, as well as in infants at 1 and 2 years of age. (B) Infants at 3 and 10 days and 4 months after the birth.

References

    1. Tannock GW. 2010. Analysis of bifidobacterial populations in bowel ecology studies, p 1–15 In Mayo B, van Sinderen D. (ed), Bifidobacteria: genomics and molecular aspects. Caister Academic Press, Norfolk, England
    1. Gronlund MM, Gueimonde M, Laitinen K, Kociubinski G, Gronroos T, Salminen S, Isolauri E. 2007. Maternal breast-milk and intestinal bifidobacteria guide the compositional development of the Bifidobacterium microbiota in infants at risk of allergic disease. Clin. Exp. Allergy 37:1764–1772 - PubMed
    1. Menard O, Butel MJ, Gaboriau-Routhiau V, Waligora-Dupriet AJ. 2008. Gnotobiotic mouse immune response induced by Bifidobacterium sp. strains isolated from infants. Appl. Environ. Microbiol. 74:660–666 - PMC - PubMed
    1. Young SL, Simon MA, Baird MA, Tannock GW, Bibiloni R, Spencely K, Lane JM, Fitzharris P, Crane J, Town I, Addo-Yobo E, Murray CS, Woodcock A. 2004. Bifidobacterial species differentially affect expression of cell surface markers and cytokines of dendritic cells harvested from cord blood. Clin. Diagn. Lab. Immunol. 11:686–690 - PMC - PubMed
    1. Storrø O, Øien T, Langsrud RK, Dotterud CK, Johnsen R. 2011. Temporal variations in early gut microbial colonization are associated with allergen-specific immunoglobulin E but not atopic eczema at 2 years of age. Clin. Exp. Allergy 41:1545–1554 - PubMed

Publication types

LinkOut - more resources