. 2013 Feb;23(2):228-35.
doi: 10.1101/gr.141382.112. Epub 2012 Nov 2.

Somatic rearrangements across cancer reveal classes of samples with distinct patterns of DNA breakage and rearrangement-induced hypermutability

Affiliations

Somatic rearrangements across cancer reveal classes of samples with distinct patterns of DNA breakage and rearrangement-induced hypermutability

Yotam Drier et al. Genome Res. 2013 Feb.

Abstract

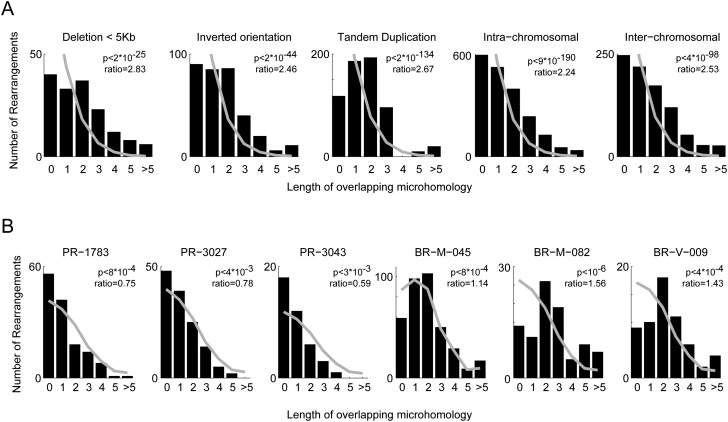
Whole-genome sequencing using massively parallel sequencing technologies enables accurate detection of somatic rearrangements in cancer. Pinpointing large numbers of rearrangement breakpoints to base-pair resolution allows analysis of rearrangement microhomology and genomic location for every sample. Here we analyze 95 tumor genome sequences from breast, head and neck, colorectal, and prostate carcinomas, and from melanoma, multiple myeloma, and chronic lymphocytic leukemia. We discover three genomic factors that are significantly correlated with the distribution of rearrangements: replication time, transcription rate, and GC content. The correlation is complex, and different patterns are observed between tumor types, within tumor types, and even between different types of rearrangements. Mutations in the APC gene correlate with and, hence, potentially contribute to DNA breakage in late-replicating, low %GC, untranscribed regions of the genome. We show that somatic rearrangements display less microhomology than germline rearrangements, and that breakpoint loci are correlated with local hypermutability with a particular enrichment for transversions.


Figures

Figure 1.
Figure 1.
Overlapping microhomology. (A) By rearrangement type. (Gray line) The expected distribution, by permuting rearrangement pairs. All rearrangement types show higher microhomology than expected by chance. Tandem duplications display the highest microhomology rate with microhomology of length 2 being the most common case. Short deletions (up to 5 kb) and inversions show more microhomology than other rearrangements. Scholz-Stephens P-value for significant difference between histograms is <10−6. (B) Rearrangement count by sample for six extreme samples. (Gray line) The expected distribution, controlled for the composition of the different rearrangement types. The three prostate samples show less microhomology than expected (notice the high fraction of breakpoints with no microhomology), and the three breast samples show more (low fraction of breakpoints with no microhomology). Expected distribution was constructed to control for the different rearrangement types and the homologies they display in our cohort. These are the only samples passing FDR < 10% (and in fact satisfy FDR < 4%).
Figure 2.
Figure 2.
Breakpoints in transcribed and untranscribed regions. Each square represents enrichment (red) or depletion (blue) of breakpoints in transcribed regions defined by maximal distance to transcribed gene. Size represents P-value, and color represents ratio. Only tests that passed 10% FDR are shown. Notice that regions of ∼104 bp were often significantly enriched or depleted. (Right) The average ratio (across samples). The colored bar above specifies the type of cancer for each sample.
Figure 3.
Figure 3.
Breakpoint distribution as a function of transcription, replication, and GC content across samples. (A) Each row represents a different bin of replication time, GC content, or distance from transcribed gene. Each square represents significant (FDR < 10%) enrichment or depletion, size represents P-value, and color represents ratio. Only samples with at least one significant bin are shown. The colored bar above specifies the type of cancer for each sample. Most samples are either enriched for breakpoints in early replicating, high %GC transcribed regions of the genome (EHT), or in late replicating, low %GC untranscribed regions (LLU), as can be seen in the bar chart. The samples are sorted by the agreement with that pattern. (B) The breaking of each cancer to EHT (red), LLU (blue) and gray samples (without any significant extreme bin, or with contradicting enrichments).
Figure 4.
Figure 4.
Hypermutability near breakpoints. (A) Enrichment of mutations across all samples by mutation type. Square represents mutation rate in concentric nonoverlapping exponential windows around each breakpoint, compared with overall mutation rates in the 71 samples cohort, aggregating them together. Size represents P-value, and color represents ratio. Only significant (FDR < 10%) results are shown. Hypermutation can be seen in a close proximity of the breakpoint, but it is even stronger in 100 bp to 1 kb surroundings. (B) Similar analysis per sample in 1-kb windows reveals that for some samples the mutation rate can reach 1000×–3000× fold. (C) Hypermutation is not only due to rearrangement and mutations occurring in the same “bad” regions of the genome. For each sample we defined the 1-kb regions according to their rearrangements and measured the mutations in those regions in all other samples of the same cancer type, aggregating them together. Squares represent P-value (by size) and ratio (by color) comparing the mutation rate in each selected sample to the mutation rate at the other samples of the same cancer type. Any sample with significant hypermutation displays significant elevation in mutation rate near breakpoints of that sample. (D) Mutation spectrum near breakpoints compared with spectrum across the genome of that sample. Hypermutated samples are often skewed toward formula image transversions near breakpoints. Melanoma samples show depletion of formula image transitions near breakpoints due to high formula image transitions across the genome.

References

    1. Banerji S, Cibulskis K, Rangel-Escareno C, Brown KK, Carter SL, Frederick AM, Lawrence MS, Sivachenko AY, Sougnez C, Zou L, et al. 2012. Sequence analysis of mutations and translocations across breast cancer subtypes. Nature 486: 405–409 - PMC - PubMed
    1. Bass AJ, Lawrence MS, Brace LE, Ramos AH, Drier Y, Cibulskis K, Sougnez C, Voet D, Saksena G, Sivachenko A, et al. 2011. Genomic sequencing of colorectal adenocarcinomas identifies a recurrent VTI1A-TCF7L2 fusion. Nat Genet 43: 964–968 - PMC - PubMed
    1. Beale RC, Petersen-Mahrt SK, Watt IN, Harris RS, Rada C, Neuberger MS 2004. Comparison of the differential context-dependence of DNA deamination by APOBEC enzymes: Correlation with mutation spectra in vivo. J Mol Biol 337: 585–596 - PubMed
    1. Benjamini Y, Hochberg Y 1995. Controlling the false discovery rate: A practical and powerful approach to multiple testing. J R Stat Soc Ser B Methodol 57: 289–300
    1. Berger MF, Lawrence MS, Demichelis F, Drier Y, Cibulskis K, Sivachenko AY, Sboner A, Esgueva R, Pflueger D, Sougnez C, et al. 2011. The genomic complexity of primary human prostate cancer. Nature 470: 214–220 - PMC - PubMed

LinkOut - more resources