. 2013 May 1;521(7):1664-82.
doi: 10.1002/cne.23252.

Projections of the superior colliculus to the pulvinar in prosimian galagos (Otolemur garnettii) and VGLUT2 staining of the visual pulvinar

Affiliations

Projections of the superior colliculus to the pulvinar in prosimian galagos (Otolemur garnettii) and VGLUT2 staining of the visual pulvinar

Mary K L Baldwin et al. J Comp Neurol. .

Abstract

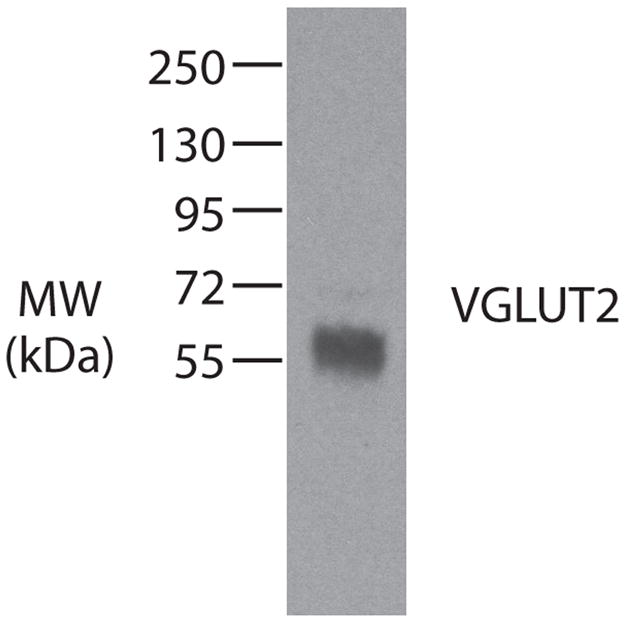
An understanding of the organization of the pulvinar complex in prosimian primates has been somewhat elusive due to the lack of clear architectonic divisions. In the current study we reveal features of the organization of the pulvinar complex in galagos by examining superior colliculus (SC) projections to this structure and comparing them with staining patterns of the vesicular glutamate transporter, VGLUT2. Cholera toxin subunit β (CTB), Fluoro-ruby (FR), and wheat germ agglutinin conjugated with horseradish peroxidase (WGA-HRP) were placed in topographically different locations within the SC. Our results showed multiple topographically organized patterns of projections from the SC to several divisions of the pulvinar complex. At least two topographically distributed projections were found within the lateral region of the pulvinar complex, and two less obvious topographical projection patterns were found within the caudomedial region, in zones that stain darkly for VGLUT2. The results, considered in relation to recent observations in tree shrews and squirrels, suggest that parts of the organizational scheme of the pulvinar complex in primates are present in rodents and other mammals.


Conflict of interest statement

Conflict of Interest statement

The authors report no conflicts of interest

Figures

Figure 1
Figure 1
Western blot characterization of the VGLUT2 antibody in galago striate cortex. The antibody recognizes a 56 kDa protein, which is the known molecular weight of VGLUT2.
Figure 2
Figure 2
Architecture of the superior colliculus and dorsal lateral geniculate nucleus in galagos. A. The superior colliculus can be subdivided into seven main layers based on cytochrome oxidase (CO): stratum zonale (SZ), stratum griseum superficiale (SGS), stratum opticum (SO), stratum griseum intermediate (SGI), stratum album intermediate (SAI), stratum griseum profundum (SGP), and stratum album profundum (SAP). B. Shows a cross section of the superior colliculus processed for VGLUT2 mRNA expression. Strong expression of VGLUT2 mRNA can be seen within the lower SGS. Scale bar is 1mm.
Figure 3
Figure 3
Subdivisions of the pulvinar complex in prosimian galagos revealed in coronal sections of the pulvinar processed for CO, AChE, or VGLUT2. The line drawings on the far left column (A, E, I, M, Q) depict the borders within the pulvinar complex in coronal sections based on different staining procedures. Cytochrome oxidase (B, F, J, N, R) staining patterns reveal the medial pulvinar complex (J, N, R) because of its lighter CO staining intensity relative to surrounding subdivisions of the pulvinar complex. In ideal staining, the posterior region of the pulvinar can be demarcated from surrounding subdivisions by its darker CO staining pattern (B and F). AChE stained sections help indicate the medial pulvinar from surrounding subdivisions by the lighter AChE staining in this subdivision (K, O, S); however, there is little difference in staining patterns between the posterior, inferior, and lateral subdivisions. Dense VGLUT2 staining is present within the posterior pulvinar complex (D, H, L, P) located medially within the whole pulvinar complex. This staining pattern matches the pattern observed in CO under ideal CO staining procedures. Additionally, a protrusion in the most ventrolateral aspect of the posterior division is evident (D, H). Additionally, a region at the most lateral aspect of the lateral pulvinar stains darkly for VGLUT2 (P and T). This staining pattern is also evident within AChE stained sections (K, O, S) by slightly darker AChE staining, as well as an apparent septa between this region and the rest of the lateral pulvinar (S). Caudal sections are presented at the top of the panel, while rostral sections are presented progressively towards the bottom of the panel. Scale bar is 1mm.
Figure 4
Figure 4
VGLUT2 staining in the caudal half of the pulvinar complex in galagos. Photomicrographs of VGLUT2 stained sections from the most caudal (top) to more rostral sections (bottom) through the pulvinar complex in caudal (top panel). Within the VGLUT2 staining region, to divisions are present. One large division along the medial aspect of the caudal pulvinar, the posterior pulvinar (Pp), and an additional, smaller division located ventrolaterally, the posterior central pulvinar (Ppc). Scale bar is 1mm.
Figure 5
Figure 5
Reconstruction of the terminal label within the pulvinar complex after CTB and FR injections in the superior colliculus for case 09-34. A. Reconstruction of the terminal label within the brainstem and thalamus. Small red dots represent FR terminal label, while red triangles represent retrogradely labeled cells. Blue dots represent CTB terminal label, and blue squares represent retrogradely labeled cells. Solid lines indicate the borders of nuclei within the brainstem and thalamus, while dashed lines within the pulvinar complex represent the proposed borders determined using VGLUT2, CO, and AChE staining patterns. Pp is the posterior pulvinar, PI is the inferior pulvinar, PM is the medial pulvinar, LGNd is the dorsal lateral geniculate nucleus, LGNv is the ventral lateral geniculate nucleus, MGN is the medial geniculate nucleus, Lim is the limitans, Rt is the reticular nucleus. B. is a dorsal view reconstruction depicting the location of the injection sites within the superior colliculus with red representing the fluoro ruby injection site, and blue representing the CTB injection site. Lines depicting the topographic layout of the superior colliculus were superimposed onto the reconstruction from results of Lane et al. 1973. The grey regions around the main SC circle represent the medial and lateral walls of the superior colliculus flattened and unfolded to the sides. In this and following figures the plus and minus signs indicate upper and lower visual field locations along the medial/lateral extent of the superior colliculus. Photomicrographs of the CTB and FR injection sites in coronal sections of the superior colliculus are indicated in C and D respectively. E and F. are photomicrographs of the terminal label depicted in the outlined boxes of A section 158. Scale bars for A, C, and D are 1mm, E and F are 0.5mm.
Figure 6
Figure 6
Reconstruction of terminal label within the pulvinar complex after a superior colliculus injection in case 10-51. A and B are photomicrographs of the fluoro ruby (FR), and cholera toxin subunit B (CTB) injection sites in coronal sections within the superior colliculus. C shows the dorsal view reconstruction of the FR and CTB injection sites throughout the flattened superior colliculus. D and E are close up photomicrographs of CTB and FR terminal label in sections 138 and 143 shown in F respectively. F is the reconstruction of terminal CTB (blue dots) and FR (red dots) terminal label within the pulvinar complex. Retrogradely labeled FR cells are also shown (red triangles). Scale bars for A, B and F are 1mm, D is 0.5mm and E is 0.25mm.
Figure 7
Figure 7
Close up view of the terminal label within sections 173 and 178 from case 09-34 (A) and sections 138 and 142 of case 10-51 (B) with adjacent VGLUT2 stained sections. Two patches of label for each tracer are noticeable. One set of isolated patches of CTB and FR terminal label are within the larger medial body of the VGLUT2 staining region, which we have tentatively named posterior pulvinar (Pp). Additional patches of terminal label are present within the protrusion of VGLUT2 staining off the most ventrolateral aspect of Pp, for which we tentatively name posterior central pulvinar (Ppc). Scale bar is 1mm.
Figure 8
Figure 8
Terminal label within the pulvinar complex after WGA-HRP injection into the superior colliculus of galago case 11-61. A Dark field photomicrographs of WGA-HRP label within the pulvinar complex with borders determined using cytochrome oxidase staining shown in white. The extent of the tracer spread is depicted in the dorsal view reconstruction of the superior colliculus B. Scale bar for A is 1mm.
Figure 9
Figure 9
The distribution of terminal label within the pulvinar complex after an injection in the caudolateral aspect of the superior colliculus of a galago, case 11-41. A is a photomicrograph of the FR injection site within the superior colliculus. The location is within the caudal and lateral aspect of the superior colliculus representing the peripheral upper field. B is a reconstruction of terminal label within the pulvinar complex. C is an estimate of the location of the injection site in the dorsal view of the superior colliculus. D and E are photomicrographs of terminal label within sections 123 and 133 of B respectively. Scale bars for A and B are 1mm, Scale bars for A and B are 1mm, C and D are 0.25mm.
Figure 10
Figure 10
Organization schemes of the pulvinar complex with superior colliculus (SC) inputs and VGLUT2 staining patterns for various members of the Euarchontoglires clade. A. Gray squirrels, based on descriptions from Baldwin et al., 2011. C is the caudal pulvinar, RLm is the rostral lateral medial pulvinar, RLl is the rostral lateral lateral pulvinar, RM is the rostral medial pulivnar and LGNd is the dorsal lateral geniculate nucleus. B. Tree shrews based on descriptions of Luppino et al., 1988, Lyon et al., 2003a, and Chomsung et al., 2008. Pd is the dorsal pulvinar, Pc is the central pulvinar, and Pv is the ventral pulvinar. C. Proposed organization of the pulvinar complex in galagos. D. Anthropoid primates based on descriptions in Stepniewska et al., 1999, and Stepniewska et al., 2000. PM is the medial pulvinar, PL is the lateral pulvinar, PIp is the posterior inferior pulivnar, PIm is the medial inferior pulvinar, PIcm is the central medial inferior pulvinar, PIcl is the central lateral inferior pulvinar. VGLUT2 staining for D is based on unpublished data.

References

    1. Abramson BP, Chalupa LM. Multiple pathways from the superior colliculus to the extrageniculate visual thalamus of the cat. J Comp Neurol. 1988;271:397–418. - PubMed
    1. Adams MM, Patrick RH, Gattass R, Webster MJ, Ungerleider LG. Visual cortical projections and chemoarchitecture of macaque monkey pulvinar. J Comp Neurol. 2000;419:377–393. - PubMed
    1. Allman JM, Kaas JH, Lane RH, Miezin FM. A representation of the visual field in the inferior nucleus of the pulvinar in the owl monkey (Aotus trivirgatus) Brain Res. 1972;40:291–302. - PubMed
    1. Atencio FW, Diamond IT, Ward JP. Behavioral study of the visual cortex of galago senegalensis. J Comp Neurol. 1975;89:1109–35. - PubMed
    1. Balaram P, Takahata T, Kaas JH. VGLUT2 mRNA and protein expression in the visual thalamus and midbrain of prosimian galagos (Otolemur garnetti) Eye and Brain. 2011;3:5–15. - PMC - PubMed

Publication types

MeSH terms

Substances

LinkOut - more resources