Review
. 2012 Nov 1;2(11):a007641.
doi: 10.1101/cshperspect.a007641.

The pathogenesis and natural history of type 1 diabetes

Affiliations
Review

The pathogenesis and natural history of type 1 diabetes

Mark A Atkinson. Cold Spring Harb Perspect Med. .

Abstract

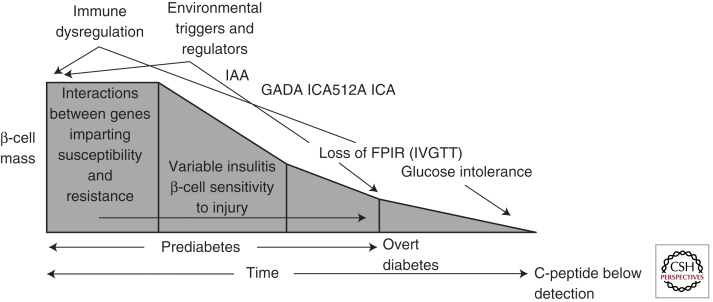
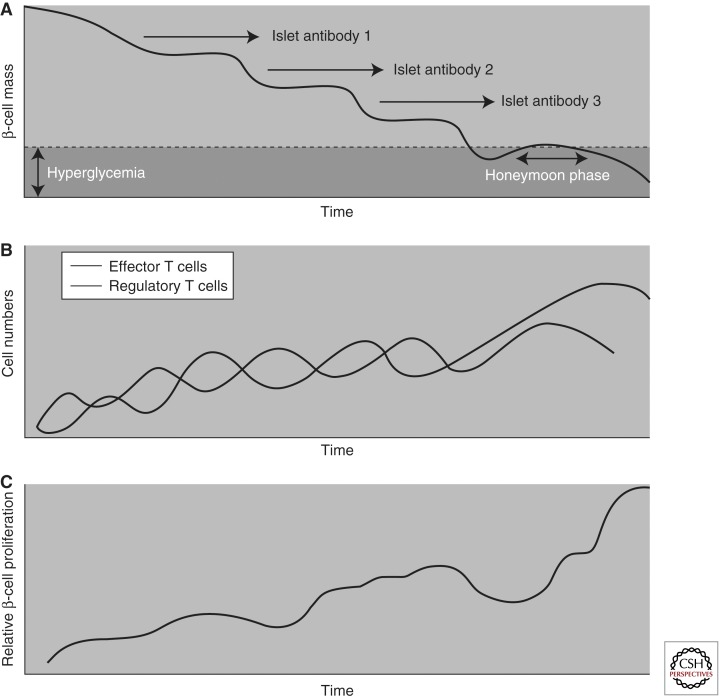
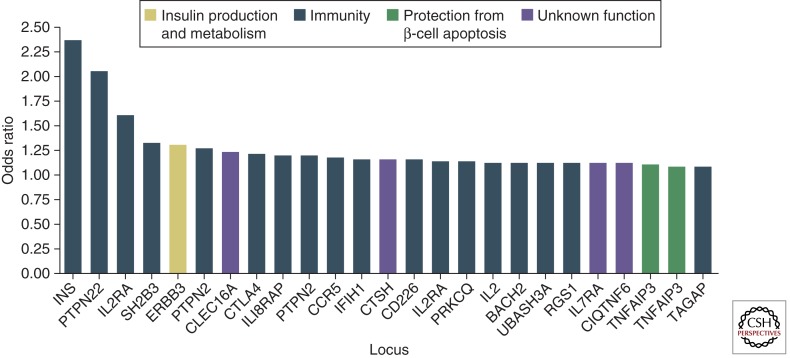
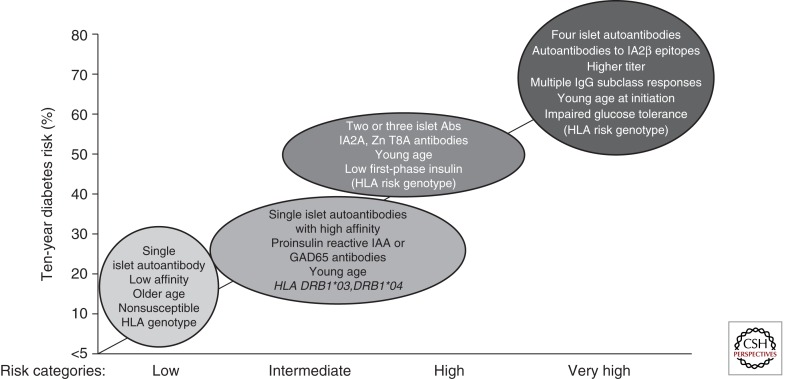
The purpose of this article is to provide an overview that summarizes much in the way of our current state of knowledge regarding the pathogenesis and natural history of type 1 diabetes in humans. This information is presented to the reader as a series of seminal historical discoveries that, when advanced through research, transformed our understanding of the roles for the immune system, genes, and environment in the formation of this disease. In addition, where longitudinal investigations of these three facets occurred, their roles within the development of type 1 diabetes, from birth to symptomatic onset and beyond, are discussed, including their most controversial elements. Having an understanding of this disorder's pathogenesis and natural history is key for attempts seeking to understand the issues of what causes type 1 diabetes, as well as to develop a means to prevent and cure the disorder.


Figures

Figure 1.
Figure 1.
Model of the pathogenesis and natural history of type 1 diabetes. The modern model expands and updates the traditional model by inclusion of information gained through an improved understanding of the roles for genetics, immunology, and environment in the natural history of T1D. (Adapted from Atkinson and Eisenbarth 2001; with permission.)
Figure 2.
Figure 2.
Model for type 1 diabetes as a relapsing-remitting disease. (A) Graph showing the stepwise, nonlinear decline of β-cell mass over time, as well as the development of autoantibodies that are associated with hyperglycemia, that is, the onset of T1D. (B) The immunological response to T1D is cyclic. An increase in the numbers of autoreactive effector T cells is controlled by an increase in the number of regulatory T cells. However, over time, a gradual disequilibrium of the cyclical behavior could occur, leading to the number of autoreactive effector T cells surpassing the number of regulatory T cells, which would no longer be capable of containing autoreactive effector T-cell responses and thereby lead to a decline in pancreatic islet function. (C) β-Cell proliferation increases in a cyclical fashion over time. This figure indirectly depicts the biological trends of the development of T1D, which may be attributed to the cyclical nature of the immunological events that lead to the attack or protection of β cells. Such a phenomenon is usually the result of feedback-loop mechanisms, which, in the case of T1D, could be due to misdirected effector T cells that are not easily controlled by regulatory T cells. The inflammatory process of the pancreatic islets themselves may enhance β-cell proliferation and antigenic presentation, ultimately leading to the generation of more effector and regulatory T cells. In addition, as β-cell mass declines, the pressure on each β-cell to produce insulin increases, which may be sufficient to alter the recognition of β cells by the immune system and to alter their ability to regenerate and increase insulin production. (Adapted from von Herrath et al. 2007; with permission.)
Figure 3.
Figure 3.
Putative functions of non-HLA-associated loci in type 1 diabetes. The y-axis indicates the best estimate of the odds ratio for risk alleles at each of the indicated loci on the basis of currently published data. Although not shown, the HLA region has a predicted odds ratio of ∼6.8. On the x-axis are indicated possible candidate genes within genomic regions in which convincing associations with T1D have been reported. On the basis of the known functions of these candidate genes, the corresponding bars in the graph depicting odds ratios have been color-coded to suggest possible roles of these loci in susceptibility to T1D. At IL2RA and TNFAIP3, there is evidence of two independent effects on risk with different odds ratios; thus these loci both appear twice in the figure. An excellent resource for current information on all aspects of genes implicated in T1D is T1DBase (www.t1dbase.org). (Adapted from Concannon et al. 2009; with permission.)
Figure 4.
Figure 4.
Type 1 diabetes risk stratification by islet autoantibody properties. (Adapted from Ziegler and Nepom 2010; with permission.)

References

    1. Adler K, Mueller DB, Achenbach P, Krause S, Heninger AK, Ziegler AG, Bonifacio E 2011. Insulin autoantibodies with high affinity to the bovine milk protein α casein. Clin Exp Immunol 164: 42–49 - PMC - PubMed
    1. Akirav E, Kushner JA, Herold KC 2008. β-Cell mass and type 1 diabetes: Going, going, gone? Diabetes 57: 2883–2888 - PMC - PubMed
    1. Alberti KG, Zimmet PZ 1998. Definition, diagnosis and classification of diabetes mellitus and its complications. Part 1: Diagnosis and classification of diabetes mellitus provisional report of a WHO consultation. Diabet Med 15: 539–553 - PubMed
    1. American Diabetes Association 2010. Diagnosis and classification of diabetes mellitus. Diabetes Care 33: S62–S69 - PMC - PubMed
    1. Atkinson MA 2005. ADA Outstanding Scientific Achievement Lecture 2004. Thirty years of investigating the autoimmune basis for type 1 diabetes: Why can’t we prevent or reverse this disease? Diabetes 54: 1253–1263 - PubMed