

doi: 10.1542/peds.2012-0596.
Epub 2012 Nov 5.
Clinical tracking of severely obese children: a new growth chart
Affiliations
- PMID: 23129082
- PMCID: PMC4528342
- DOI: 10.1542/peds.2012-0596
Item in Clipboard
Clinical tracking of severely obese children: a new growth chart
Pediatrics.
2012 Dec.
Abstract
The 2000 Centers for Disease Control and Prevention growth charts are unable to accurately define and display BMI percentiles beyond the 97th percentile. At Children's Hospital Colorado, we created new growth charts that allow clinicians to track and visualize BMI values in severely obese children. This growth chart defines a child's BMI as a "percentage of the 95th percentile." It has the potential to allow clinicians to define subgroups of severe obesity, monitor trends in obese children, and measure treatment success or failure.
Figures
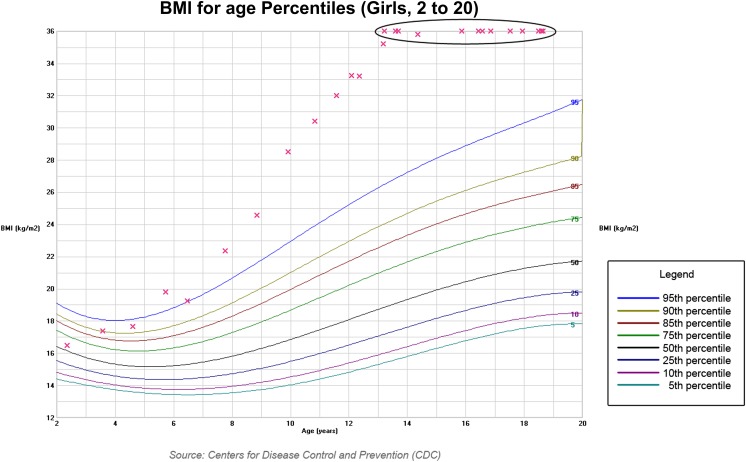
CDC BMI (2000) growth chart, girls aged 2 to 20 years.
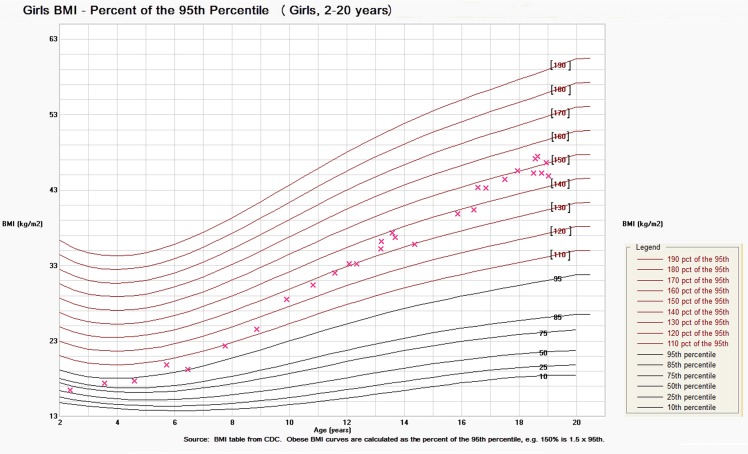
Obesity BMI growth chart, girls aged 2 to 20 years.
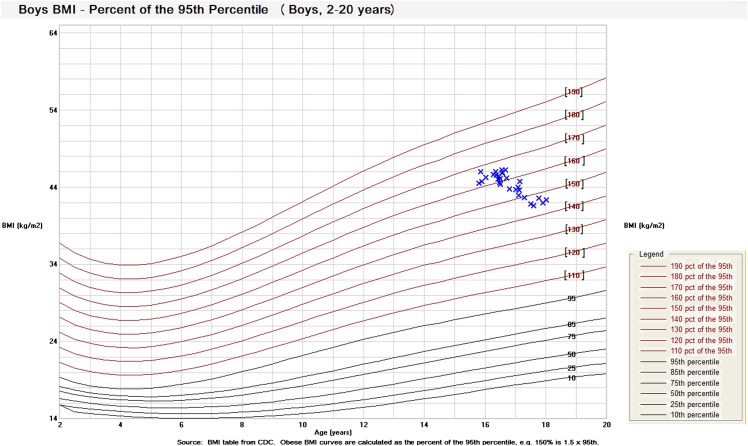
Obesity BMI growth chart, boys aged 2 to 20 years.
References
-
- Freedman DS, Mei Z, Srinivasan SR, Berenson GS, Dietz WH. Cardiovascular risk factors and excess adiposity among overweight children and adolescents: the Bogalusa Heart Study. J Pediatr. 2007;150(1):12–17, e2 - PubMed
-
- Ogden CL, Kuczmarski RJ, Flegal KM, et al. Centers for Disease Control and Prevention 2000 growth charts for the United States: improvements to the 1977 National Center for Health Statistics version. Pediatrics. 2002;109(1):45–60 - PubMed
-
- Woo JG. Using body mass index Z-score among severely obese adolescents: a cautionary note. Int J Pediatr Obes. 2009;4(4):405–410 - PubMed
-
- Kuczmarski RJ, Ogden CL, Guo SS, et al. 2000 CDC Growth Charts for the United States: methods and development. Vital Health Stat 11. 2002;246(246):1–190 - PubMed
-
- Cole TJ. The LMS method for constructing normalized growth standards. Eur J Clin Nutr. 1990;44(1):45–60 - PubMed
MeSH terms
Grants and funding
LinkOut - more resources
Full Text Sources
Other Literature Sources
