Review
. 2013 May;218(3):611-43.
doi: 10.1007/s00429-012-0475-5. Epub 2012 Nov 6.

Predictions not commands: active inference in the motor system

Affiliations
Review

Predictions not commands: active inference in the motor system

Rick A Adams et al. Brain Struct Funct. 2013 May.

Abstract

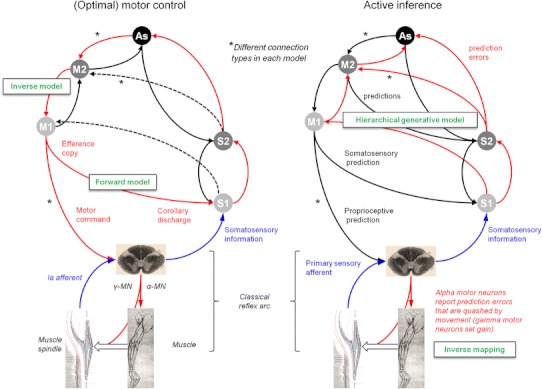
The descending projections from motor cortex share many features with top-down or backward connections in visual cortex; for example, corticospinal projections originate in infragranular layers, are highly divergent and (along with descending cortico-cortical projections) target cells expressing NMDA receptors. This is somewhat paradoxical because backward modulatory characteristics would not be expected of driving motor command signals. We resolve this apparent paradox using a functional characterisation of the motor system based on Helmholtz's ideas about perception; namely, that perception is inference on the causes of visual sensations. We explain behaviour in terms of inference on the causes of proprioceptive sensations. This explanation appeals to active inference, in which higher cortical levels send descending proprioceptive predictions, rather than motor commands. This process mirrors perceptual inference in sensory cortex, where descending connections convey predictions, while ascending connections convey prediction errors. The anatomical substrate of this recurrent message passing is a hierarchical system consisting of functionally asymmetric driving (ascending) and modulatory (descending) connections: an arrangement that we show is almost exactly recapitulated in the motor system, in terms of its laminar, topographic and physiological characteristics. This perspective casts classical motor reflexes as minimising prediction errors and may provide a principled explanation for why motor cortex is agranular.


Figures

Fig. 1
Fig. 1
Motor control, optimal control and active inference: these simplified schematics ignore the contributions of spinal circuits and subcortical structures; and omit many hierarchical levels (especially on the sensory side). M1, S1, M2 and S2 signify primary and secondary motor and sensory cortex (S2 is area 5, not ‘SII’), while As signifies prefrontal association cortex. Red arrows denote driving ‘forward’ projections, and black arrows modulatory ‘backward’ projections. Afferent somatosensory projections are in blue. α-MN and γ-MN signify alpha- and gamma motor neuron output. The dashed black arrows in the optimal control scheme show what is different about optimal control compared with earlier serial models of the motor system: namely, the presence of sensory feedback connections to motor cortices. Under the active inference (predictive coding) scheme, all connections are reciprocal, with backward-type descending connections and forward-type ascending connections. They are descending from motor to sensory areas because the motor areas are above somatosensory areas in the hierarchy (see Fig. 4a). Anatomical implications The motor control and active inference models have identical connection types in the sensory system, but opposite connection types in the motor system (examples are indicated with asterisks). The nature of these connections should therefore disambiguate between the two models. The active inference model predicts descending motor connections should be backward-type, while conventional motor control schemes require the descending connections to convey driving motor commands. Predictions and prediction errors In the active inference scheme, backward connections convey predictions, and the forward connections deliver prediction errors. In the motor control scheme, the descending forward connections from M1 convey motor commands computed by an inverse model for generating movements and efference copy required by a forward model, for predicting its sensory consequences. The classical reflex arc The active inference model illustrates how the classical reflex arc performs an inverse mapping from sensory predictions to action (motor commands). The (classical) reflex arcs we have in mind are a nuanced version of Granit’s (1963) proposal that, in voluntary movements, a reference value is set by descending signals, which act on both the alpha and gamma motor neurons—known as alpha-gamma coactivation (Matthews ; Feldman and Orlovsky 1972). In this setting, the rate of firing of alpha motor neurons is set (by proprioceptive prediction errors) to produce the desired (predicted) shortening of the muscle, though innervation of extrafusal muscle fibres; while the rate of firing of gamma motor neurons optimises the sensitivity or gain of muscle spindles, though innervation of intrafusal muscle fibres. Note the emphasis here is on alpha motor neurons as carrying proprioceptive prediction errors derived from the comparison of descending predictions (about movement trajectories) and primary afferents (see Fig. 2). In this setting, gamma motor neurons are considered to provide context-sensitive modulation or gain of primary afferents (e.g. ensure they report changes in muscle length and velocity within their dynamic range). Forward and inverse models Conventional (computational) motor control theory uses the notion of forward–inverse models to explain how the brain generates actions from desired sensory states (the inverse model) and predicts the sensory consequences of action (the forward model). In these schemes, the inverse model has to generate a motor command from sensory cues—a complex transformation—and then a forward model uses an efference copy of this command to generate a predicted proprioceptive outcome called corollary discharge (Wolpert and Kawato 1998). In active inference a forward or generative model generates both proprioceptive and sensory predictions—a simple transformation—and an inverse mapping converts a proprioceptive prediction into movement. This is a relatively well-posed problem and could be implemented by spinal reflex arcs (Friston et al. 2010). In the terminology of this paper, optimal control’s inverse model maps from an extrinsic frame to an intrinsic frame and from an intrinsic frame to motor commands. The inverse mapping in active inference is simply from the intrinsic frame to motor commands. This figure omits the significant contribution of the cerebellum to the forward model
Fig. 2
Fig. 2
Generation of spinal prediction errors and the classical reflex arc. This schematic provides examples of spinal cord circuitry that are consistent with its empirical features and could mediate proprioceptive predictions. They all distinguish between descending proprioceptive predictions of (Ia and Ib) primary afferents and predictions of the precision of the ensuing prediction error. Predictions of precision optimise the gain of prediction error by facilitating descending predictions (through NMDA receptor activation) and the afferents predicted (through gamma motor neuron drive to intrafusal muscle fibres). This necessarily entails alpha-gamma coactivation and renders descending predictions (of precision) facilitatory. The prediction errors per se are simply the difference between predictions and afferent input. The left panel considers this to be mediated by convergent monosynaptic (AMPA-R mediated) descending projections (‘CM’ neurons) and inhibition, mediated by the inhibitory interneurons of Ib (Rudomin and Schmidt 1999) or II (Bannatyne et al. 2006) afferents. The middle and right panels consider the actions of Ia afferents, which drive (or disinhibit) alpha motor neurons, in opposition to (inhibitory) descending predictions. The middle panel is based on Hultborn et al. (1987) and the right panel on Lindström (1973). Note that corticospinal neurons synapse directly with spinal motor neurons and indirectly via interneurons (Lemon 2008). When a reflex is elicited by stretching a tendon, sudden lengthening of the (fusimotor) muscle spindle stretch receptors sends proprioceptive signals (via primary sensory Ia neurons) to the dorsal root of the spinal cord. These sensory signals excite (disinhibit) alpha motor neurons, which contract (extrafusal) muscle fibres and return the stretch receptors to their original state. The activation of alpha motor neurons by sensory afferents can be monosynaptic or polysynaptic. In the case of monosynaptic (simple) reflex arcs (middle panel), a prediction error is generated by inhibition of the alpha motor neurons by descending predictions from upper motor neurons. In polysynaptic (spinal) reflexes, Ia inhibitory interneurons may report prediction errors (right panel). Ia inhibitory interneurons are inhibited by sensory afferents (via glycine) and this inhibition is countered by descending corticospinal efferents (Lindström 1973). In this polysynaptic case, reflex muscle fibre contractions are elicited by disinhibition of alpha motor neuron drive. Crucially, precisely the same muscle contractions can result from changes in descending (corticospinal) predictions. This could involve suspension of descending (glutamatergic) activation either of presynaptic inhibition of Ia afferents (Hultborn et al. ; reviewed by Rudomin and Schmidt 1999)—not shown—or of Ia inhibitory interneurons, and disinhibition of alpha motor neuron activity. The ensuing mismatch or prediction error is resolved by muscle contraction and a reduction in stretch receptor discharge rates. In both reflexes and voluntary movement, under active inference the motor system is enslaved to fulfil descending proprioceptive predictions. As Feldman (2009) notes, “posture-stabilizing mechanisms (i.e. classical reflex arcs) do not resist but assist the movement” [italics in original]: threshold control theory does this by changing the threshold position, active inference by changing proprioceptive predictions. The key aspect of this circuitry is that it places descending corticospinal efferents and primary afferents in opposition, through inhibitory interneurons. The role of inhibitory interneurons is often portrayed in terms of a reciprocal inhibitory control of agonist and antagonist muscles. However, in the setting of predictive coding, they play a simpler and more fundamental role in the formation of prediction errors. This role is remarkably consistent with computational architectures in the cortex and thalamus: for example, top-down projections in the sensory hierarchies activate inhibitory neurons in layer 1 which then suppress (superficial) pyramidal cells, thought to encode prediction error (Shlosberg et al. 2006). Note that there are many issues we have ignored in these schematics, such as the role of polysynaptic transformations, nonlinear dendritic integration, presynaptic inhibition by cutaneous afferents, neuromodulatory effects, the role of Renshaw cells, and other types of primary afferents
Fig. 3
Fig. 3
Topographic characteristics of forward and backward projections. a This schematic illustrates projections to and from a lower and higher level in the visual hierarchy (adapted from Zeki and Shipp 1988). Red arrows signify forward connections and black arrows backward connections. Note that there is a much greater convergence (from the point of view of neurons receiving projections) and divergence (from the point of view of neurons sending projections) in backward relative to forward connections. b This schematic is adapted from Rockland and Drash (1996), and illustrates the terminal fields of ‘typical’ forward (axon FF red) and backward (axon FB purple) connections in the visual system. IG represents infragranular collaterals of a backward connection, and ad an apical dendrite; cortical layers are labelled on the left. Note the few delimited arbours of terminals on the forward connection, and the widely distributed “wand-like array” of backward connection terminals
Fig. 4
Fig. 4
Somatomotor hierarchy and anatomy. a The somatomotor hierarchy of Felleman and Van Essen (1991), with several new areas and pathways added by Burton and Sinclair (1996). Ri, Id and Ig are in the insula, 35 and 36 are parahippocampal, and 12M is orbitomedial. The key point to note here is the high level of M1 (Brodmann’s area 4 in green) in the hierarchy. b Prefrontal areas in the macaque, taken from Petrides and Pandya (2009). The frontal motor areas have been left white, and are illustrated in the figure below. c Somatomotor areas in the macaque, adapted from Geyer et al. (2000). Areas F2, F4, F5 and F7 constitute premotor cortex, and F3 and F6 the supplementary motor area (SMA) together they form area 6. Primary motor cortex (M1) is area 4, primary sensory cortex (S1) areas 1–3, and areas 5 and 7b are secondary sensory areas. ps, as, cs, ips and ls are principal, arcuate, central, intraparietal and lunate sulci, respectively
Fig. 5
Fig. 5
Laminar systematics in the somatomotor hierarchy: this figure is updated from Shipp (2005). The diagrams show patterns of terminations (left) and cells of origin (right) in selected areas comprising the somatomotor hierarchy (shown anatomically in Fig. 4b, c). Not all connections are shown, only those for which an adequate indication of laminar characteristics is obtainable (the blue numbers provide a key to the literature). In order to compile data across studies with variable terminology and placement of injected tracers, or with similar outcomes, some areas are combined into single blocks; the ampersand should be interpreted as ‘and/or’. The diagrams are intended to give an indication of forward or backward relationships, but not the precise number of pathways or levels involved. The sensory tiers, for instance, are compressed into a single level: S1 shown as a single block, comprises four separate areas (3a, 3b, 1 and 2) that precede higher order parietal areas in a sensory hierarchy. Left panel schematic illustrations of terminal patterns—forward (2, 3, 13 and 20); intermediate (4, 5, 6, 11 and 21); and backward (1, 7–10, 12 and 14–19). Forward patterns have a concentration in layer 3. Intermediate patterns are described as columnar, with little or no laminar differentiation. Backward patterns are concentrated in layers 1 (and 6) and/or tend to avoid the lower part of layer 3. Feedback from M1 to S1 tends to avoid layer 4. Right panel laminar distribution of cells of origin, coded as the relative density of labelled cells in layers 3 and 5. In general, ascending connections are associated with a high 3:5 ratio, and descending connections with a lower 3:5 ratio (that may still exceed unity). Factors influencing cell density can vary considerably across studies and few provide quantitative cell count data. Coloured boxes emphasise four studies that provide comparative cell data for connections at two or more separate levels. Pink the ascending input to M1 from S1 has a greater 3:5 ratio than the descending input to M1 from premotor cortex (data from Ghosh et al. 1987). Green the ascending and descending inputs to premotor cortex show a similar relationship (Barbas and Pandya 1987). Brown a study in which the interconnections of M1 with premotor and supplementary motor cortex were not found to be distinct (Dum and Strick 2005). Blue the depth profile of connections from F3 (area SMA) to M1 and to premotor cortex were shown to differ, neurons projecting to M1 being less superficial (Johnson and Ferraina 1996). There are no quantitative data where the density of layer 5 cells much exceeds layer 3 cells in motor connections, and only rare qualitative descriptions to this effect, e.g. for the projection from F4 to M1 (Stepniewska et al. 1993); and from M1 to area 1 (Burton and Fabri 1995). 1 Künzle (1978a); 2 Jones et al. (1978), Shipp et al. (1998), Leichnetz (2001); 3 Jones et al. (1978), Künzle (1978b), Pons and Kaas (1986); 4 Künzle (1978b), Leichnetz (1986), Matelli et al. (1986), Stepniewska et al. (1993); 5 Barbas and Pandya (1987); 6 Künzle (1978a), Barbas and Pandya (1987); 7 Watanabe-Sawaguchi et al. (1991); 8 Künzle (1978a), Barbas and Pandya (1987), 9 Barbas and Pandya (1987), Watanabe-Sawaguchi et al. (1991); 10 Jones et al. (1978), Künzle (1978b), Leichnetz (1986), Stepniewska et al. (1993); 11 Künzle (1978a), Barbas and Pandya (1987), Watanabe-Sawaguchi et al. (1991); 12 Arikuni et al. (1988); 13 Jones et al. (1978), Pons and Kaas (1986); 14 Preuss and Goldman-Rakic (1989), Watanabe-Sawaguchi et al. (1991); 15 Künzle (1978a), Barbas and Pandya (1987), Deacon (1992); 16 Künzle (1978b), Watanabe-Sawaguchi et al. (1991); 17 Künzle (1978b), Leichnetz (1986); 18 Barbas and Pandya (1987); 19 Künzle (1978a), Matelli et al. (1986), Barbas and Pandya (1987), Deacon (1992), Gerbella et al. (2011); 20 Rozzi et al. (2006), Borra et al. (2008); 21 Barbas and Pandya (1987), Deacon (1992), Gerbella et al. (2011); 22 Jones et al. (1978), Leichnetz (1986), Ghosh et al. (1987), Huerta and Pons (1990), Darian-Smith et al. (1993), Stepniewska et al. (1993); 23 Matelli et al. (1986), Barbas and Pandya (1987), Kurata (1991), Watanabe-Sawaguchi et al. (1991); 24 Barbas and Pandya (1987), Deacon (1992); 25 Arikuni et al. (1988), Watanabe-Sawaguchi et al. (1991), Lu et al. (1994); 26 Barbas and Pandya (1987), Watanabe-Sawaguchi et al. (1991), Deacon (1992), Gerbella et al. (2011); 27 Kurata (1991); 28 Muakkassa and Strick (1979), Godschalk et al. (1984), Leichnetz (1986), Ghosh et al. (1987), Stepniewska et al. (1993), Lu et al. (1994); 29 Pons and Kaas (1986), Darian-Smith et al. (1993), Burton and Fabri (1995); 30 Dum and Strick (2005); 31 Muakkassa and Strick (1979), Godschalk et al. (1984), Leichnetz (1986), Ghosh et al. (1987), Stepniewska et al. (1993), Lu et al. (1994), Johnson and Ferraina (1996); 32 Matelli et al. (1986), Kurata (1991), Johnson and Ferraina (1996)
Fig. 6
Fig. 6
Backward termination pattern of a premotor to M1 projection: Adapted from Watanabe-Sawaguchi et al. (1991), this is a darkfield photomicrograph showing labelled cells and terminals in area 4 after injection of WGA-HRP into the inferior premotor area (PMv, or F5) of a baboon. The termination pattern is characteristic of a backward connection as it is bilaminar (with a particularly dense supragranular projection) and minimally dense in lower layer 3. W.m. signifies white matter
Fig. 7
Fig. 7
Topographic characteristics of projections in the motor system: a adapted from Shinoda et al. (1981), this is a transverse section through the spinal cord at level C7, showing a corticospinal axon that projects to at least four different motor nuclei: those of the ulnar (the upper nucleus), radial (the lower two nuclei) and medial nerves (not shown). b Adapted from Tokuno and Tanji (1993), this depicts cortical areas containing neurons projecting to proximal (white) and distal (black) movement areas of M1. Lower hierarchical areas have segregated projections, whereas higher projections are intermixed (grey) with the exception of premotor cortex, whose inputs were subsequently also shown to be intermixed (Dancause et al. 2006). CMAc caudal cingulate motor area, CMAr rostral cingulate motor area, MI primary motor cortex, PMd dorsal premotor cortex, PMv ventral premotor cortex, SI primary somatosensory cortex, SII secondary somatosensory cortex, SMA supplementary motor area
Fig. 8
Fig. 8
Somatotopic differences in ascending and descending motor projections: this figure illustrates the relative preservation of somatotopy in forward projections and the much greater convergence and divergence in backward projections in the motor system, as is found in sensory projections (schematised in Fig. 3a). a This figure is taken from Wong et al. (1978). It illustrates the spatial distribution of neurons in macaque M1 that respond to passive movement of the relevant joint (the tiny letters indicate the direction of movement, not important for our purposes). One can see that the shoulder, elbow, wrist and fingers joints’ representations are overlapping but reasonably somatotopic: non-adjacent joints do not overlap. The 15 % of neurons that responded to movement of multiple joints are not illustrated here. b This figure is taken from Boudrias et al. (2010). It illustrates the motor output maps for the premotor cortex and M1 (top right and bottom left of each drawing, respectively) of two macaques, with each row corresponding to muscles around different joints. The maps were obtained by stimulating in the dotted cortical sites and recording EMGs in peripheral muscles; the red and yellow dots signify post-stimulus facilitation and suppression, respectively. Whilst some resemblance can be seen to the sensory maps in a, it is clear that there is far more convergence and divergence of these descending projections
Fig. 9
Fig. 9
Somatomotor and somatosensory connections in active inference: In this figure, we have focused on monosynaptic reflex arcs and have therefore treated alpha motor neurons as prediction error units. In this scheme, descending (corticospinal) proprioceptive predictions (from upper motor neurons in M1) and (primary sensory) proprioceptive afferents from muscle spindles converge on alpha motor neurones on the ventral horn of the spinal cord. The comparison of these signals generates a prediction error. The gain of this prediction error is in part dependent upon descending predictions of its precision (for further explanation see ‘CM neurons and predictions of precision’ in the “Discussion”). The associated alpha motor neuron discharges elicit (extrafusal) muscle fibre contractions until prediction error is suppressed. Ascending proprioceptive and somatosensory information does not become a prediction error until it encounters descending predictions, whether in the (ventral posterior nucleus of the) thalamus, the dorsal column nuclei, or much earlier in the dorsal horn. In the cortex, error units at a given level receive predictions from that level and the level above, and project to prediction units at that level and the level above (only two levels are shown). In this way, discrepancies between actual and predicted inputs—resulting in prediction errors—can either be resolved at that level or passed further up the hierarchy (Friston et al. 2006). Prediction units project to error units at their level and the level below, attempting to explain away their activity. Crucially, active inference suggests that both proprioceptive (motor) and somatosensory systems use a similar architecture. It is generally thought that prediction units correspond to principal cells in infragranular layers (deep pyramidal cells) that are the origin of backward connections; while prediction error units are principal cells in supragranular layers (superficial pyramidal cells) that elaborate forward projections (Mumford ; Friston and Kiebel 2009). Note that we have implicitly duplicated proprioceptive prediction errors at the spinal (somatomotor) and thalamic (somatosensory) levels. This is because the gain of central (somatosensory) principal units encoding prediction error is set by neuromodulation (e.g. synchronous gain or dopamine), while the gain of peripheral (somatomotor) prediction error units is set by NMDA-Rs and gamma motor neuron activity. In predictive coding, this gain encodes the precision (inverse variance) of prediction errors (see Feldman and Friston 2010). Algorithmically, the duplication of prediction errors reflects the fact that somatomotor prediction errors drive action, while somatosensory prediction errors drive (Bayes-optimal) predictions. For reasons of clarity we have omitted connections ascending the cord in the somatomotor system, e.g. spinal projections to M1 and the transcortical reflex pathway from S1 (in particular the proprioceptive area 3a) to M1: these are described in the “Discussion”

References

    1. Akatsuka K, Wasaka T, Nakata H, Kida T, Kakigi R. The effect of stimulus probability on the somatosensory mismatch field. Exp Brain Res. 2007;181:607–614. - PubMed
    1. Andersen P, Raastad M, Storm JF. Excitatory synaptic integration in hippocampal pyramids and dentate granule cells. Cold Spring Harb Symp Quant Biol. 1990;55:81–86. - PubMed
    1. Angelucci A, Bullier J (2003) Reaching beyond the classical receptive field of V1 neurons: horizontal or feedback axons? J Physiol Paris 97:141–154 - PubMed
    1. Arikuni T, Watanabe K, Kubota K. Connections of area 8 with area 6 in the brain of the macaque monkey. J Comp Neurol. 1988;277:21–40. - PubMed
    1. Asanuma H, Zarzecki P, Jankowska E, Hongo T, Marcus S. Projection of individual pyramidal tract neurons to lumbar motor nuclei of the monkey. Exp Brain Res. 1979;34:73–89. - PubMed

LinkOut - more resources