. 2012 Dec 4;109(49):20065-70.
doi: 10.1073/pnas.1217113109. Epub 2012 Nov 5.

Mouse mtDNA mutant model of Leber hereditary optic neuropathy

Affiliations

Mouse mtDNA mutant model of Leber hereditary optic neuropathy

Chun Shi Lin et al. Proc Natl Acad Sci U S A. .

Abstract

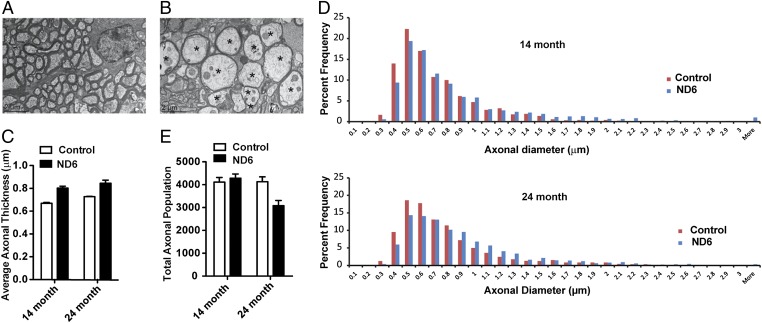
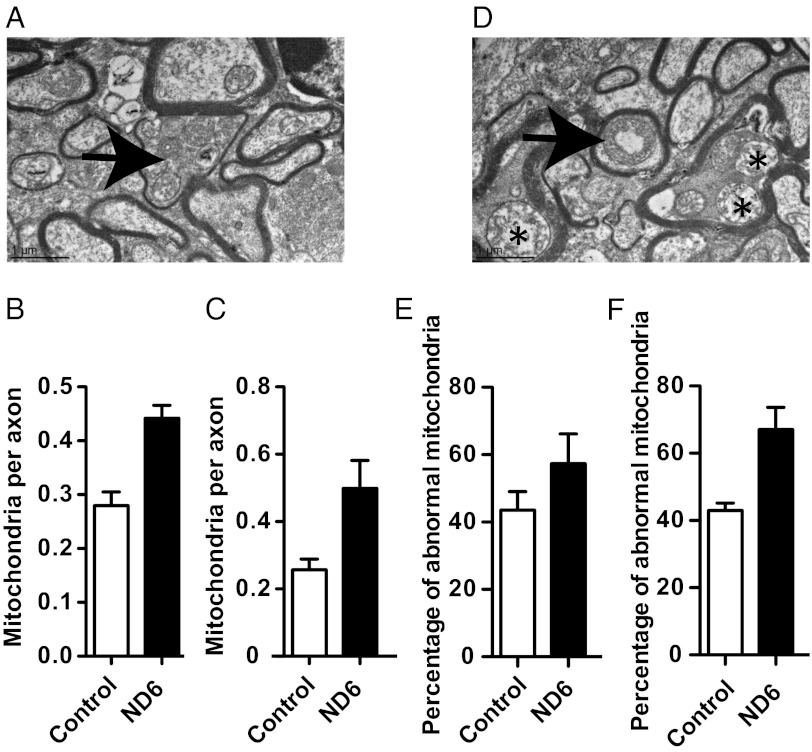
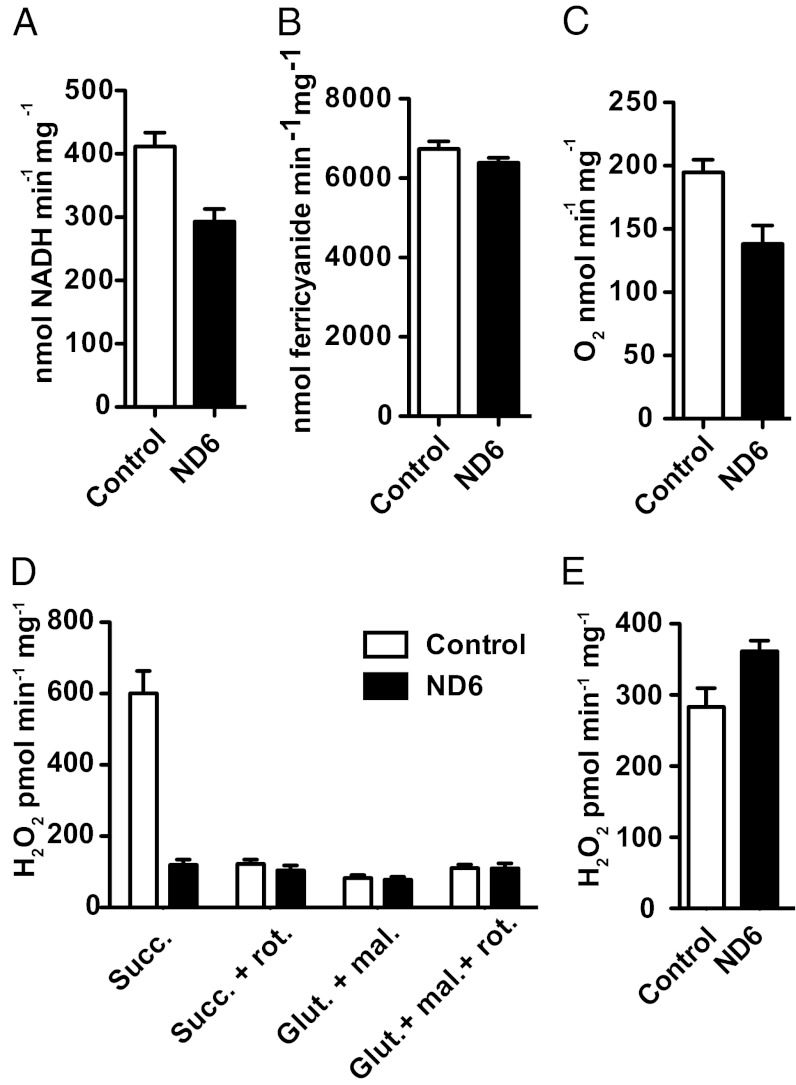
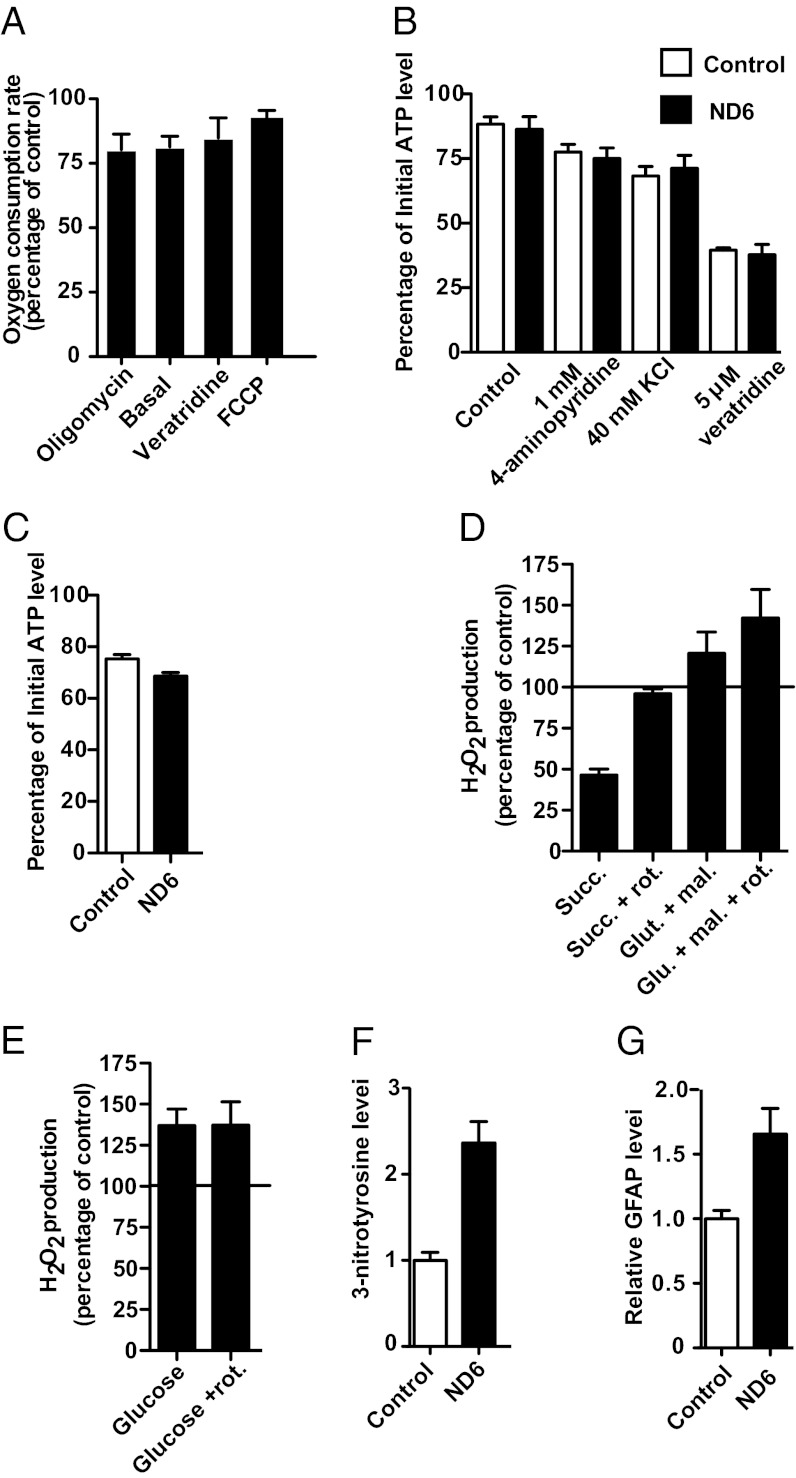
An animal model of Leber hereditary optic neuropathy (LHON) was produced by introducing the human optic atrophy mtDNA ND6 P25L mutation into the mouse. Mice with this mutation exhibited reduction in retinal function by elecroretinogram (ERG), age-related decline in central smaller caliber optic nerve fibers with sparing of larger peripheral fibers, neuronal accumulation of abnormal mitochondria, axonal swelling, and demyelination. Mitochondrial analysis revealed partial complex I and respiration defects and increased reactive oxygen species (ROS) production, whereas synaptosome analysis revealed decreased complex I activity and increased ROS but no diminution of ATP production. Thus, LHON pathophysiology may result from oxidative stress.


Conflict of interest statement

The authors declare no conflict of interest.

Figures

Fig. 1.
Fig. 1.
Ultrastructural analysis of RGC axons showing swelling and loss in ND6 mutant mice. (A and B) Fourteen-month-old wild-type (A) and 14-mo-old ND6 mutant (B) mouse retrobulbar optic nerves at 2,000× magnification. Several swollen axons with thin myelin (asterisks) can be seen adjacent to normal caliber axons (Lower Left) from a 14-mo-old ND6 mutant mouse. EM images of 24-mo-old axons can be found in Fig. S3. (C) Average axonal diameter in the 14- and 24-mo-old control and ND6 mutant mice (n = 4). (D) Histograms of percentage distribution of optic nerve axon diameters in both 14- and 24-mo-old wild-type and ND6 mutant mice (bin size, 0.1 µm). A total of 1,600 individual axons were sampled separately for 14- and 24-mo-old mutant groups. A total of 1,600 and 1,200 axons were counted for 12- and 24-mo-old wild type. The distribution of axonal diameters in the 14-mo age group showed a shift in the ND6 mutant subset to larger diameter axons, whereas those smaller than 0.5 µm in diameter were reduced in number. This trend was augmented in 24-mo age group. (E) Total axonal population determined from cross sections of optic nerve.
Fig. 2.
Fig. 2.
Ultrastructural analysis of optic nerve showing mitochondrial abnormalities in ND6 mutant mice. Quantification of mitochondria by transmission electron microscopy (EM) (4,000×). (A) The arrow indicates an axon of 14-mo-old ND6 mutant mouse characterized by mitochondrial proliferation and marked thinning of the myelin sheath. (B and C) Number of mitochondria per axon in optic nerves from 14-mo-old mice [control (n = 4): 267 mitochondria in 954 axons; mutant (n = 4): 427 mitochondria in 964 axons] (B) and 24-mo-old mice [control (n = 3): 188 mitochondria in 723 axons; mutant (n = 4): 384 mitochondria in 801 axons] (C). See Fig. S5A for mitochondrial proliferation at 24 mo. (D) Abnormal mitochondrial morphology as seen with central vacuolization (arrow) and disrupted cristae (asterisks) in 14-mo-old ND6 mutant. See Fig. S5B for mitochondrial abnormalities at 24 mo. (E and F) Percentage of abnormal mitochondria in the optic nerves of 14-mo-old mice (E) and in the optic nerves of 24-mo-old mice (F).
Fig. 3.
Fig. 3.
Complex I–related biochemistry in liver mitochondria isolated from ND6 mutant liver. (A) Rotenone-sensitive NADH:coenzyme Q1 oxidoreductase activity of liver mitochondria isolated from ND6 mutant mice and control animals (n = 5). (B) NADH:ferricyanide oxidoreductase activity of liver mitochondria (n = 5). (C) Maximal respiration rate of isolated liver mitochondria measured by polarography using glutamate and malate as substrates in the presence of excess ADP (2 mM) (n = 9). (D) Hydrogen peroxide production by isolated liver mitochondria using Amplex red to detect mitochondrial hydrogen peroxide efflux (n = 9). (E) Hydrogen peroxide production determined in SMPs prepared from liver mitochondria (n = 2). N refers to independent preparations of mitochondria or SMPs, and the assays were performed at least in triplicate for each preparation.
Fig. 4.
Fig. 4.
Bioenergetic and oxidative stress consequences of the ND6 mutation in neuronal tissue. (A) Oxygen consumption rate (OCR) of synaptosomes in the presence of 1 µg⋅mL−1 oligomycin, 5 µM veratridine, and 4 µM FCCP (n = 6). The reported results are the OCR of synaptosomes from the ND6 mutant mice expressed as a percentage of the rate of synaptosomes isolated from control mice. (B) Ability of synaptosomes from control and ND6 mutant to maintain ATP levels under energetically demanding conditions. The ATP levels of synaptosomes were determined before and after 15 min of incubation without (control) or with plasma membrane–depolarizing agents, and the results are expressed as the percentages of the initial ATP level (n = 7). In ND6 P25L mice, the initial ATP levels were 126,535 ± 14,871 relative light units (RLU)/25 µg of synaptosomes, and in B6 control mice, the initial ATP levels were 126,663 ± 10,264 RLU/25 µg. (C) ability of synaptosomes to maintain ATP levels in the presence of 100 nM rotenone (n = 3). (D) Rate of hydrogen peroxide production by nonsynaptosomal brain mitochondria measured using the Amplex red system (n = 5). The rate is expressed as the percentage difference between mitochondria isolated from the ND6 mutant and control mice at the same time. (E) Rate of hydrogen peroxide generation from synaptosomes in the presence and absence of rotenone (4 µM) using glucose as a substrate (n = 7). The rate is expressed as the percentage. (F and G) Immunoblotting of 3-nitrotyrosine (F) and GFAP (G) levels in whole-brain lysates (n = 5). N refers to independent preparations of mitochondria, synaptosomes, or whole-cell lysates. Assays were performed at least in triplicate for each preparation.

Comment in

  • Leber hereditary optic neuropathy and oxidative stress.
    Zhuo Y, Luo H, Zhang K. Zhuo Y, et al. Proc Natl Acad Sci U S A. 2012 Dec 4;109(49):19882-3. doi: 10.1073/pnas.1218953109. Epub 2012 Nov 29. Proc Natl Acad Sci U S A. 2012. PMID: 23197830 Free PMC article. No abstract available.

References

    1. Wallace DC, et al. Mitochondrial DNA mutation associated with Leber’s hereditary optic neuropathy. Science. 1988;242(4884):1427–1430. - PubMed
    1. Sadun AA, La Morgia C, Carelli V. Leber’s hereditary optic neuropathy. Curr Treat Options Neurol. 2011;13(1):109–117. - PubMed
    1. Huoponen K, Vilkki J, Aula P, Nikoskelainen EK, Savontaus ML. A new mtDNA mutation associated with Leber hereditary optic neuroretinopathy. Am J Hum Genet. 1991;48(6):1147–1153. - PMC - PubMed
    1. Johns DR, Neufeld MJ, Park RD. An ND-6 mitochondrial DNA mutation associated with Leber hereditary optic neuropathy. Biochem Biophys Res Commun. 1992;187(3):1551–1557. - PubMed
    1. Jun AS, Brown MD, Wallace DC. A mitochondrial DNA mutation at np 14459 of the ND6 gene associated with maternally inherited Leber’s hereditary optic neuropathy and dystonia. Proc Natl Acad Sci USA. 1994;91(13):6206–6210. - PMC - PubMed

Publication types

MeSH terms