

Trends and inequalities in cardiovascular disease mortality across 7932 English electoral wards, 1982-2006: Bayesian spatial analysis
- PMID: 23129720
- PMCID: PMC3535748
- DOI: 10.1093/ije/dys151
Trends and inequalities in cardiovascular disease mortality across 7932 English electoral wards, 1982-2006: Bayesian spatial analysis
Abstract
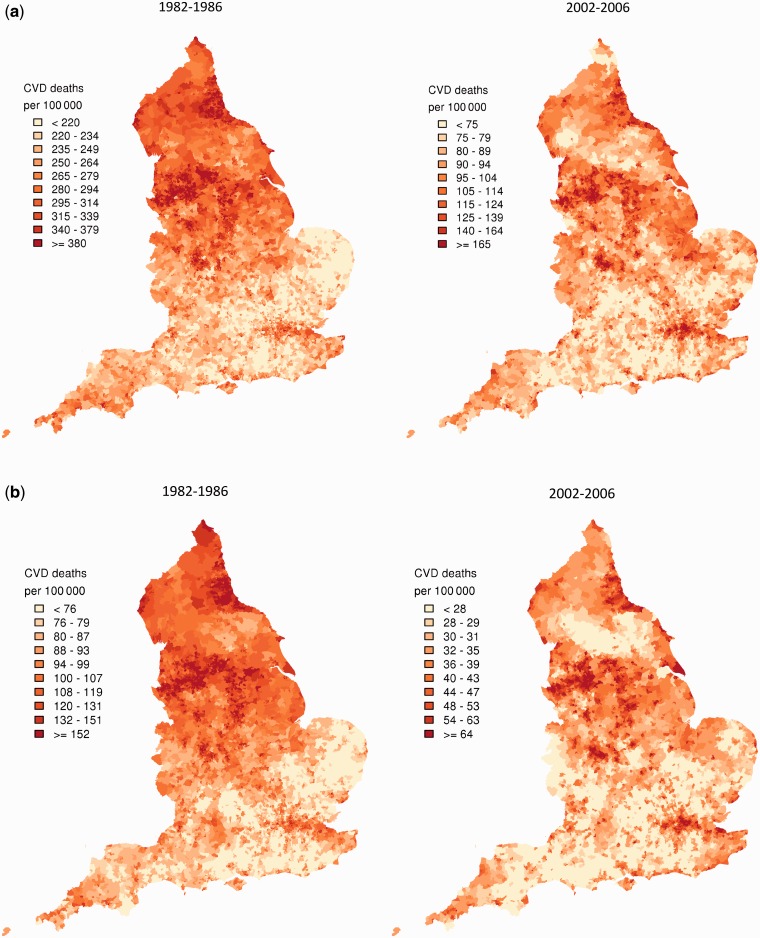
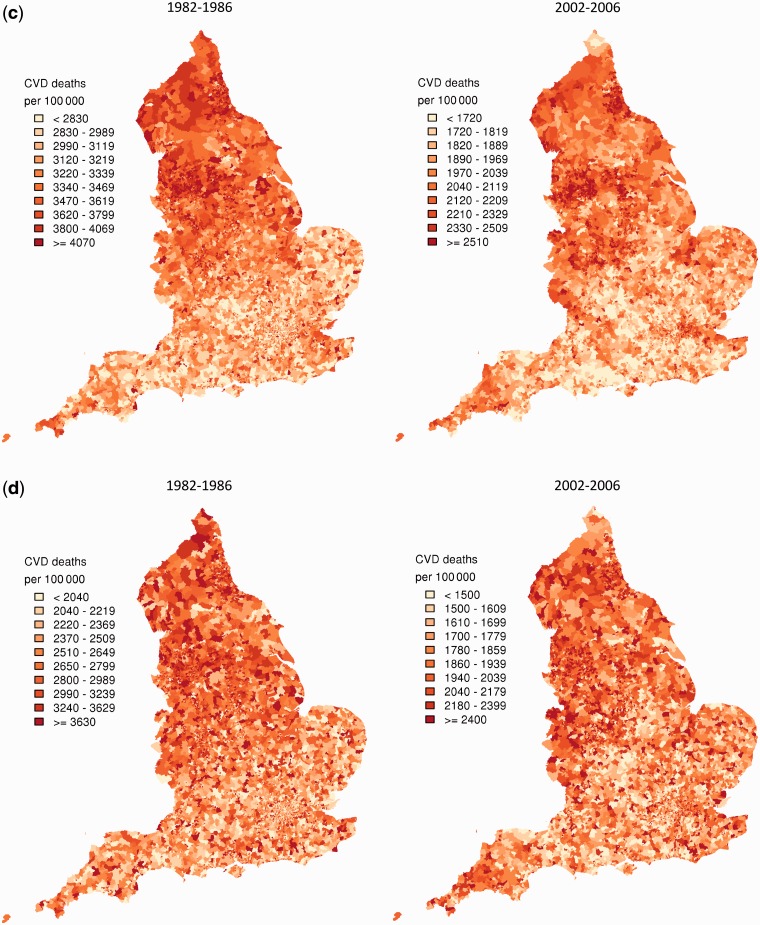
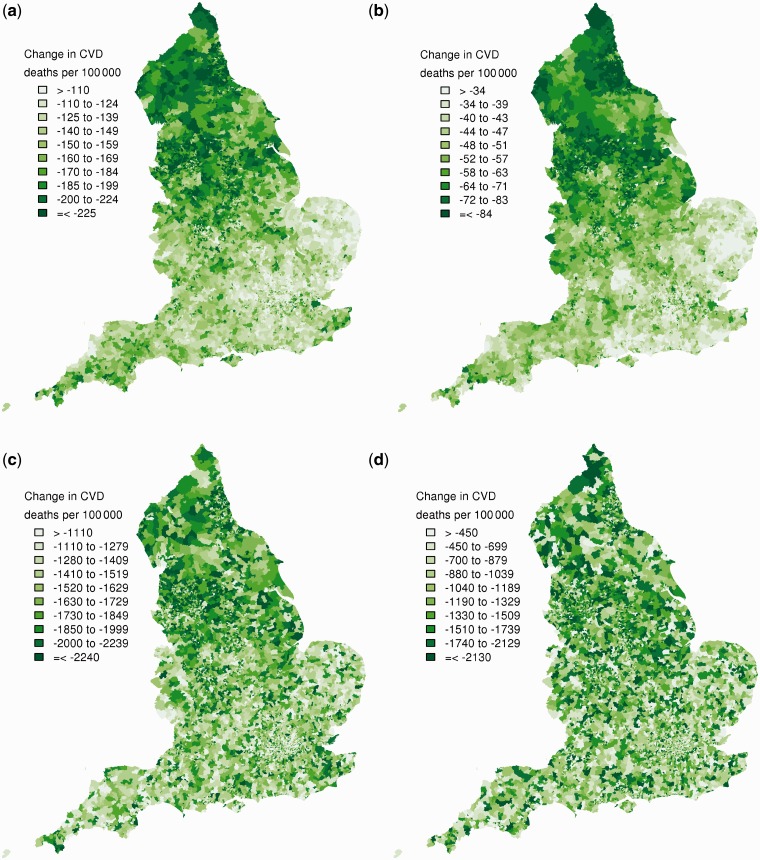
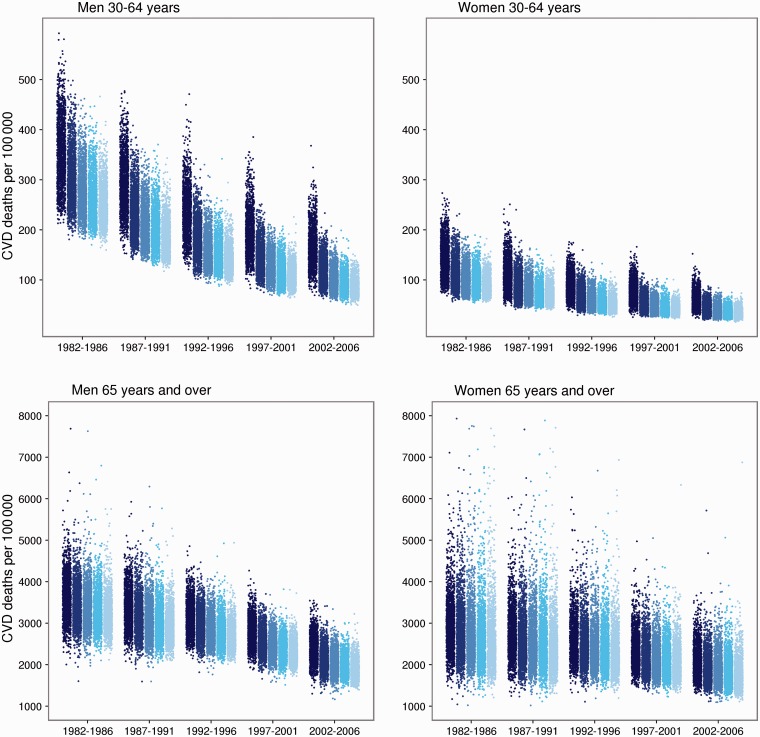
Background: Cardiovascular disease (CVD) mortality has more than halved in England since the 1980s, but there are few data on small-area trends. We estimated CVD mortality by ward in 5-year intervals between 1982 and 2006, and examined trends in relation to starting mortality, region and community deprivation.
Methods: We analysed CVD death rates using a Bayesian spatial technique for all 7932 English electoral wards in consecutive 5-year intervals between 1982 and 2006, separately for men and women aged 30-64 years and ≥65 years.
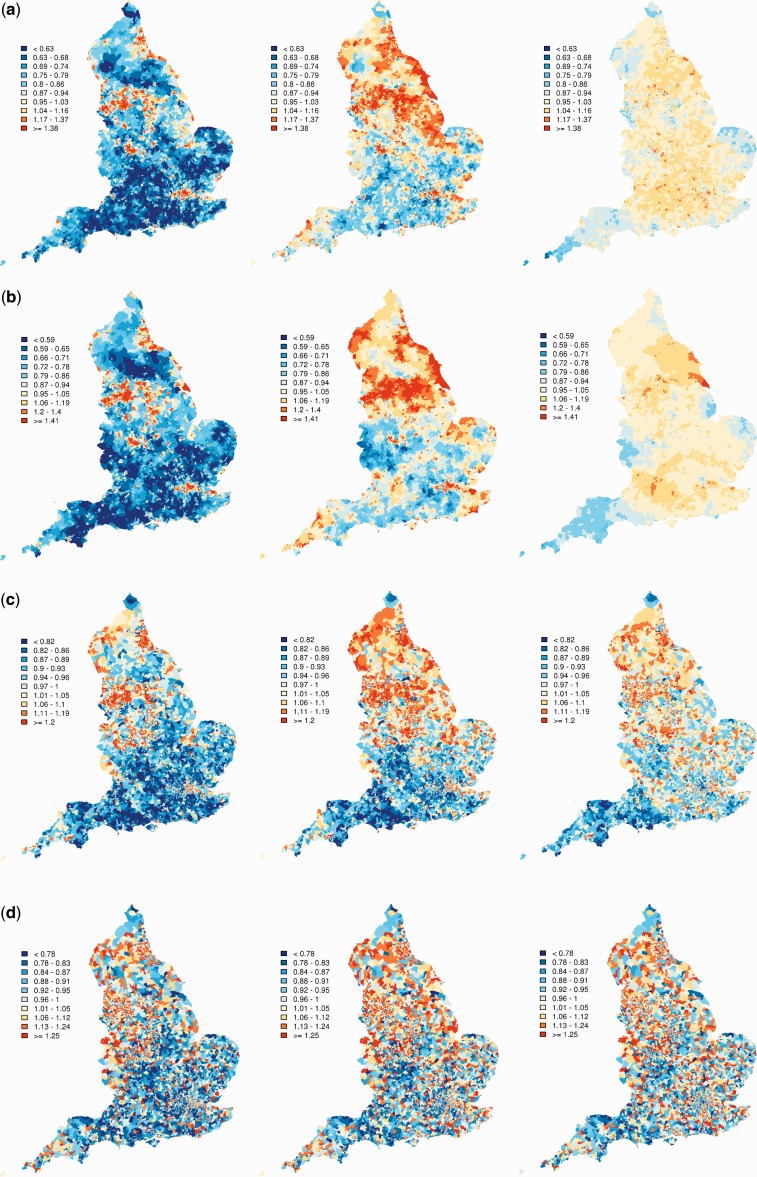
Results: Age-standardized CVD mortality declined in the majority of wards, but increased in 186 wards for women aged ≥65 years. The decline was larger where starting mortality had been higher. When grouped by deprivation quintile, absolute inequality between most- and least-deprived wards narrowed over time in those aged 30-64 years, but increased in older adults; relative inequalities worsened in all four age-sex groups. Wards with high CVD mortality in 2002-06 fell into two groups: those in and around large metropolitan cities in northern England that started with high mortality in 1982-86 and could not 'catch up', despite impressive declines, and those that started with average or low mortality in the 1980s but 'fell behind' because of small mortality reductions.
Conclusions: Improving population health and reducing health inequalities should be treated as related policy and measurement goals. Ongoing analysis of mortality by small area is essential to monitor local effects on health and health inequalities of the public health and healthcare systems.
Figures
Comment in
-
Commentary: when bad news is worse than it sounds.Int J Epidemiol. 2012 Dec;41(6):1750-2. doi: 10.1093/ije/dys174. Int J Epidemiol. 2012. PMID: 23283717 No abstract available.
References
-
- Uren Z, Fitzpatrick J, Reid A, Goldblatt P. Geographic variation in mortality by social class and alternative social classifications. In: Griffiths C, Fitzpatrick J, editors. Geographic Variations in Health. London: The Stationery Office; 2001. pp. 339–58.
-
- Uren Z, Fitzpatrick J. Analysis of mortality by deprivation and cause of death. In: Griffiths C, Fitzpatrick J, editors. Geographic Variations in Health. London: The Stationery Office; 2001.
-
- Scarborough P, Peto V, Bhatnagar P, et al. Stroke Statistics 2009. Oxford: British Heart Foundation Statistics Database; 2009.
