Case Reports
. 2012 Nov 19;209(12):2247-61.
doi: 10.1084/jem.20120831. Epub 2012 Nov 5.

Congenital B cell lymphocytosis explained by novel germline CARD11 mutations

Affiliations
Case Reports

Congenital B cell lymphocytosis explained by novel germline CARD11 mutations

Andrew L Snow et al. J Exp Med. .

Abstract

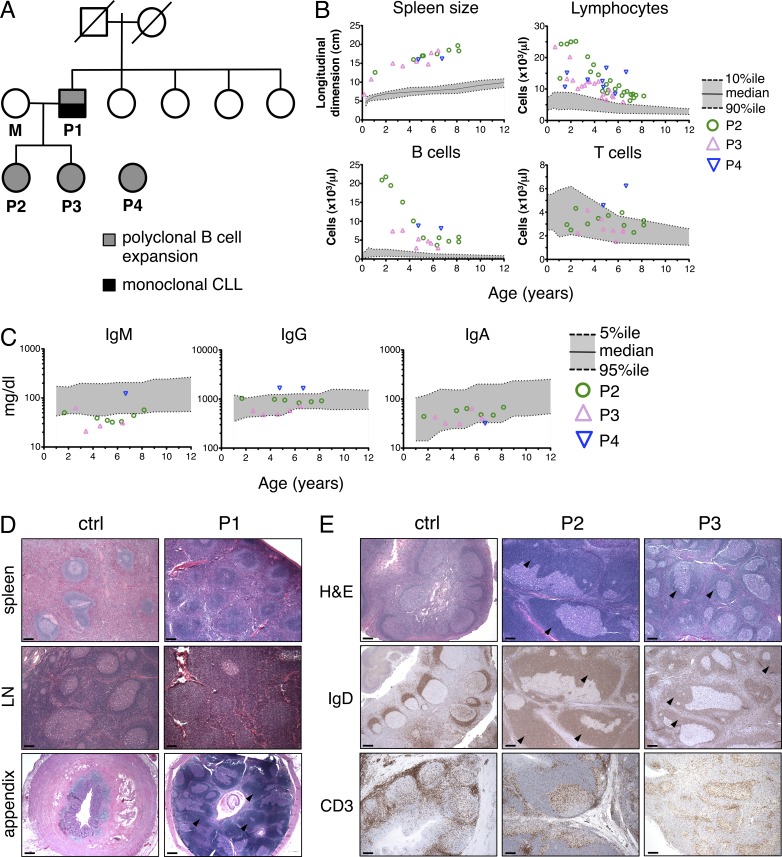
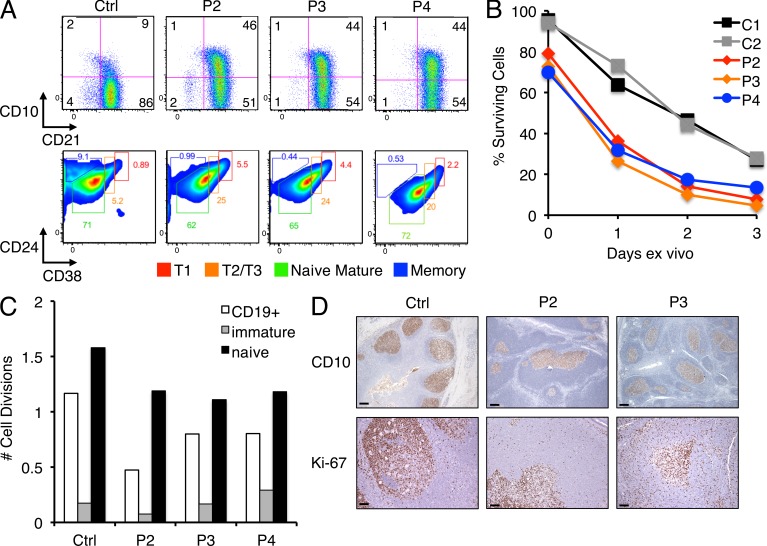
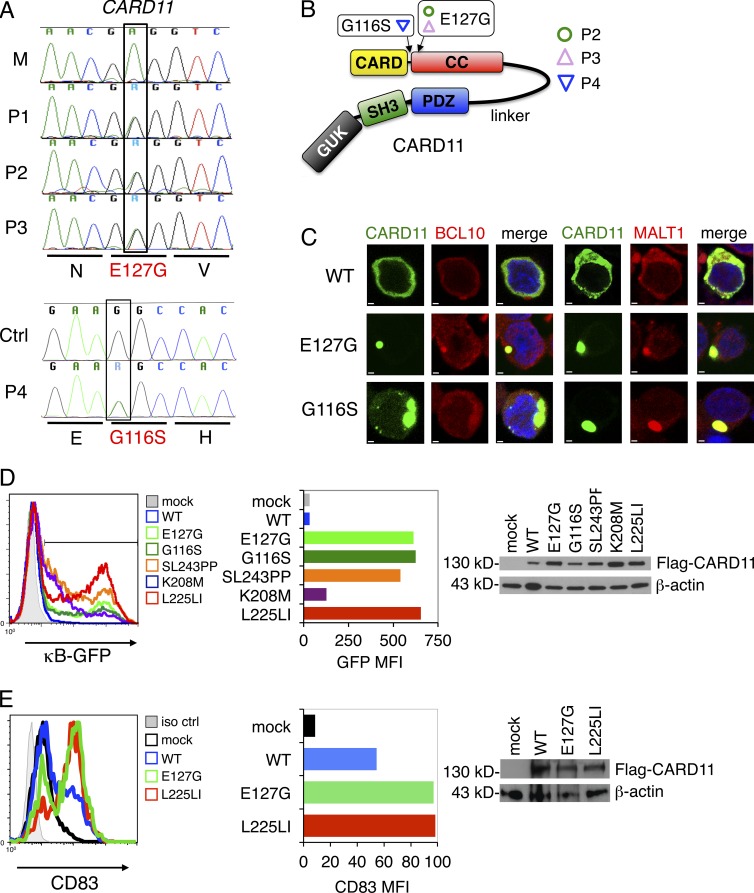
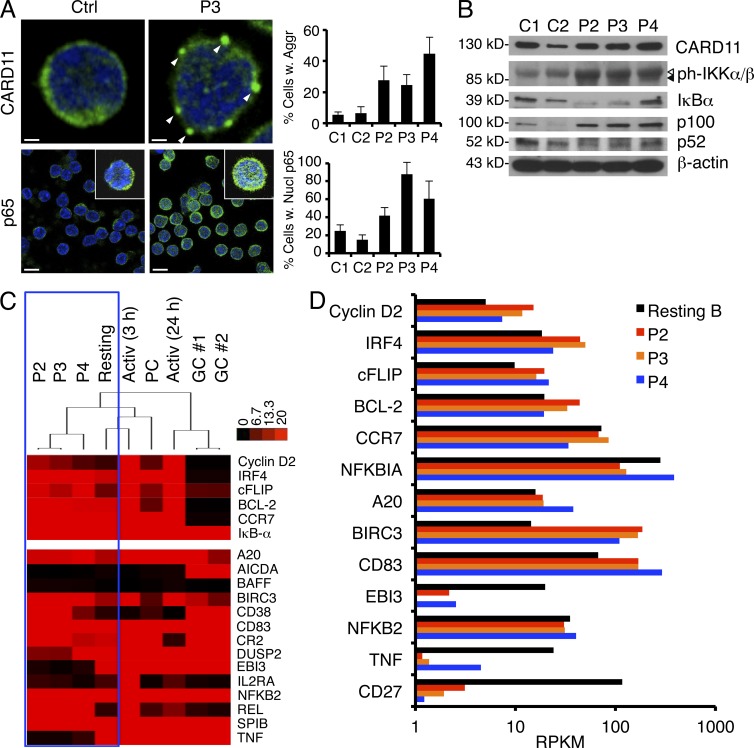
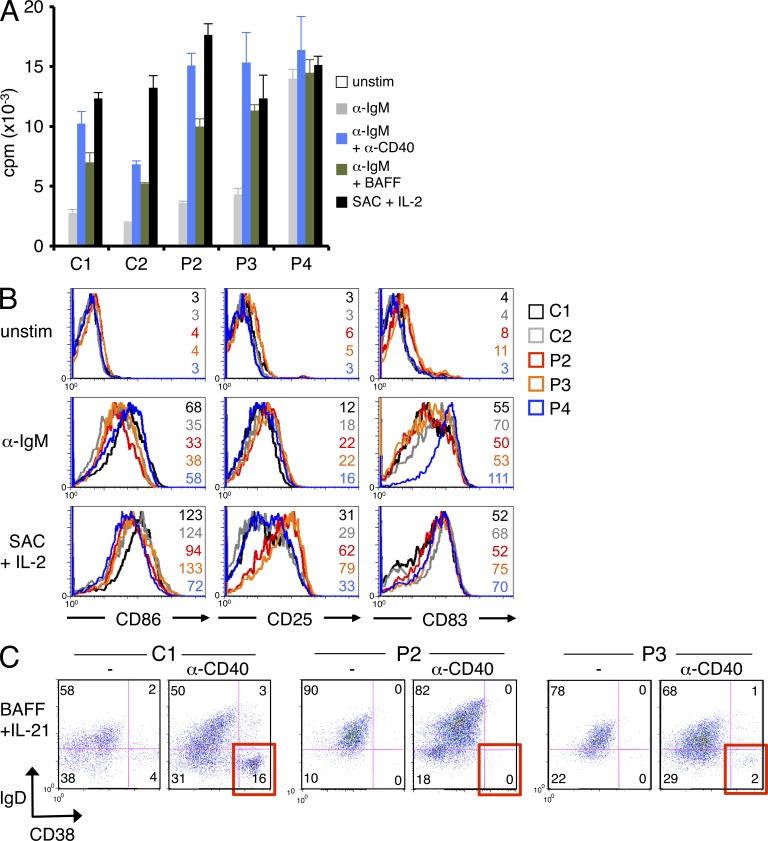
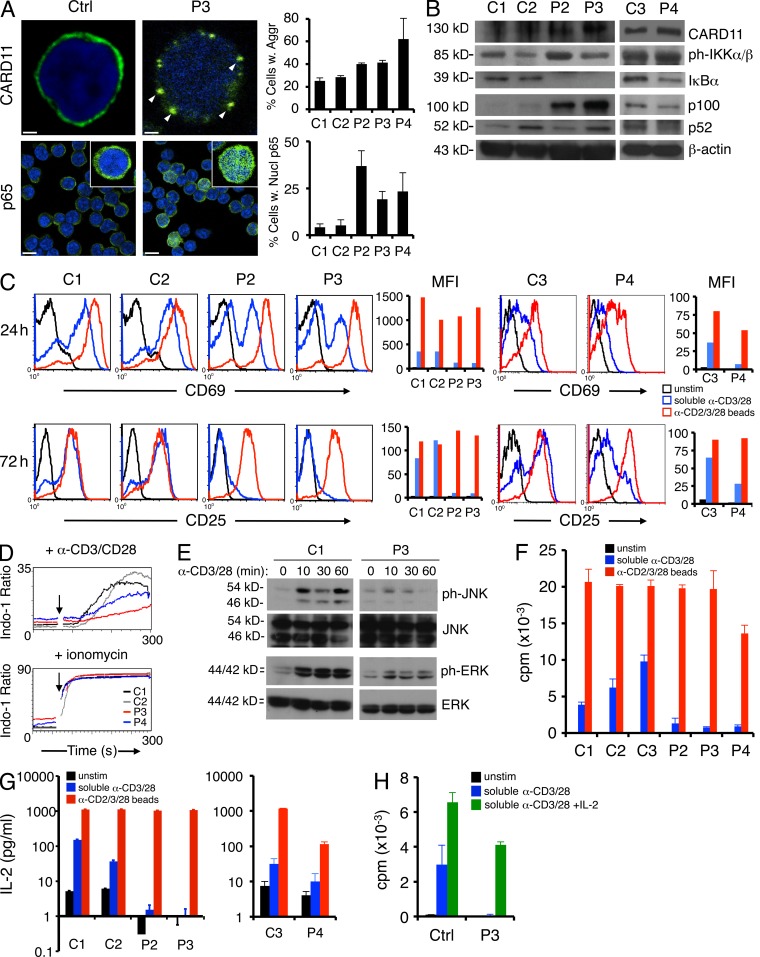
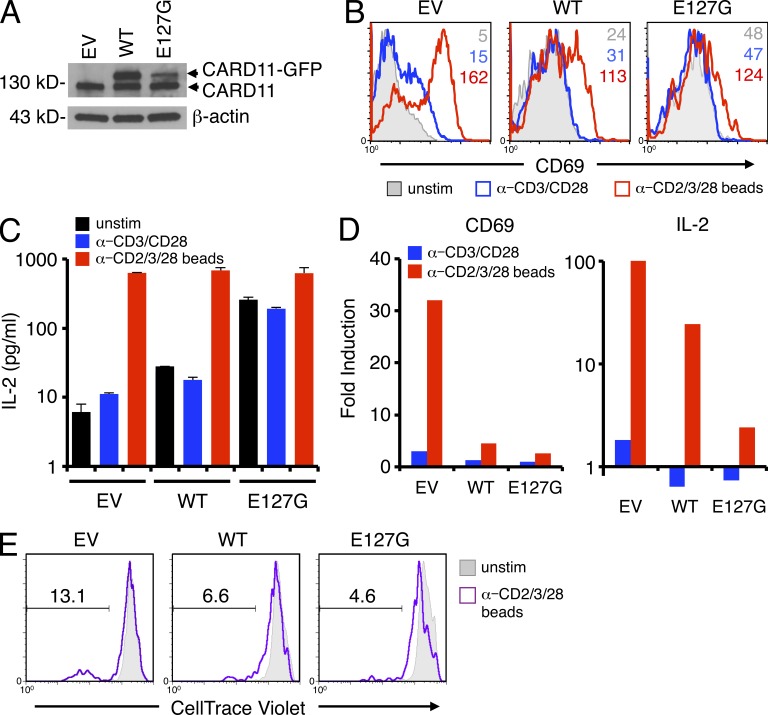
Nuclear factor-κB (NF-κB) controls genes involved in normal lymphocyte functions, but constitutive NF-κB activation is often associated with B cell malignancy. Using high-throughput whole transcriptome sequencing, we investigated a unique family with hereditary polyclonal B cell lymphocytosis. We found a novel germline heterozygous missense mutation (E127G) in affected patients in the gene encoding CARD11, a scaffolding protein required for antigen receptor (AgR)-induced NF-κB activation in both B and T lymphocytes. We subsequently identified a second germline mutation (G116S) in an unrelated, phenotypically similar patient, confirming mutations in CARD11 drive disease. Like somatic, gain-of-function CARD11 mutations described in B cell lymphoma, these germline CARD11 mutants spontaneously aggregate and drive constitutive NF-κB activation. However, these CARD11 mutants rendered patient T cells less responsive to AgR-induced activation. By reexamining this rare genetic disorder first reported four decades ago, our findings provide new insight into why activating CARD11 mutations may induce B cell expansion and preferentially predispose to B cell malignancy without dramatically perturbing T cell homeostasis.


Figures

Figure 1.
Figure 1.
Family pedigree and analysis of B cell lymphocytosis. (A) Family pedigree of P1–3. Circles represent females, squares represent males, and slashes through symbols represent deceased individuals. Solid gray symbols indicate those affected with polyclonal B cell lymphocytosis. Solid black symbols denote progression to monoclonal B-CLL in P1. (B) Total lymphocytes, spleen size, and absolute counts of B cells and T cells in peripheral blood from patients were measured over time by flow cytometry. The gray zone delineates the median and normal range (between 10th and 90th percentile) in age-matched individuals. (C) Serum Ig titers in patients were measured over time by ELISA; gray zone delineates median and normal range (between 5th and 95th percentile). (D) H&E staining of spleen, lymph node, and appendix tissue sections from P1, taken at 34 mo of age (right). Control specimens (ctrl) are shown for comparison (left), including an age-matched lymph node biopsy showing reactive follicular hyperplasia. (E) Histochemical analysis of tonsil sections from control reactive tonsil, P2, and P3 stained with H&E, anti-IgD, and anti-CD3. Black arrowheads mark expanded mantle zones in D and E. Representative photographs are shown. Bars, 500 µm.
Figure 2.
Figure 2.
Elevated transitional B cell output in patients without increased cell survival or replication in the peripheral blood. (A) Flow cytometric identification of CD10+CD21+ transitional B cells (top) in patient versus control (Ctrl) PBMCs, including subsets defined by CD24 and CD38 expression (bottom). Gates delineate T1, T2/T3, mature naive, and memory B cells. Gates were adjusted for P4 based on separate matched controls, analyzed on a different day. (B) Ex vivo survival assay for purified naive B cells from patients and controls, with cell death quantitated daily using Annexin V and propidium iodide staining. Data are representative of four independent experiments. (C) Comparison of in vivo replication history by KREC analysis (displayed as number of cell divisions) using sorted transitional and mature naive B cells from controls and patients. The control shown is distinct from that shown in A. (D) CD10 and Ki-67 staining of tonsil sections from control, P2, and P3, with positive staining restricted to GCs. Representative photographs are shown. Bars: (top) 500 µm; (bottom) 200 µm.
Figure 3.
Figure 3.
E127G and G116S CARD11 spontaneously aggregate and drive constitutive NF-κB activation. (A) Sanger dideoxy DNA sequencing confirmation of heterozygous missense mutations (A to G substitution or vice versa, designated as purine or “R”) in exon 5 of the CARD11 gene in P1, P2, and P3 (not in mother [M]) and exon 4 of CARD11 in P4 (not in control [Ctrl]). Amino acids are shown in single letter code. (B) Schematic representation of the CARD11 protein (Lenz et al., 2008a). The E127G and G116S amino acid changes within the CC region of CARD11 are denoted. (C) Ectopic expression of WT, E127G, or G116S CARD11 as N-terminal fluorescent fusion proteins (myc/Venus-CARD11) in BJAB B cells. BCL10 or MALT1 were visualized by immunofluorescence staining using Alexa Fluor 594–conjugated secondary Abs. Bars, 1 µm. (D) Plasmids encoding Flag-tagged WT, E127G, G116S, or other DLBCL-derived somatic, active mutant CARD11 were transfected into CARD11-deficient JPM50.6 cells containing a κB-driven GFP reporter gene, and GFP expression was analyzed by flow cytometry. Histograms (left) and MFI of GFP+ cells (middle) are shown, indicating the relative amount of NF-κB activity. Immunoblots confirming expression of Flag-CARD11 proteins are shown at right; β-actin served as a loading control. (E) BJAB B cells were transfected with a GFP expression plasmid plus Flag-tagged CARD11 constructs as listed in D. Flow cytometry of BJAB B cells transfected with a GFP expression plasmid plus Flag-tagged CARD11 constructs as listed in D and then stained with anti-CD83 was performed. Quantitated MFI of CD83 expression in GFP+ cells is shown (middle). Immunoblots confirming expression of CARD11 proteins are shown at right with a β-actin loading control. (C–E) Data are representative of three (C and E) or four (D) independent experiments.
Figure 4.
Figure 4.
CARD11 aggregation and elevated NF-κB activity in patient primary B cells. (A) Expression of CARD11 and p65 visualized by immunofluorescence and confocal microscopy in fixed, purified naive B cells. The percentage of cells with visible CARD11 aggregates (marked by white arrowheads) or >50% p65 in the nucleus was quantified for each sample in by scoring >200 cells from multiple fields. Insets in bottom row show individual cells from the same field. Scoring data represent the mean ± standard deviation from two independent scorers. Bars: (top) 1 µm; (bottom) 10 µm. (B) Representative immunoblots of total naive B cell lysates prepared from normal donor controls (C1 and C2) and patients for proteins listed on the right of each blot. Arrowheads denote phospho–IKK-β (open) and phospho–IKK-α (closed). (A and B) Data are representative of three independent experiments. (C) Hierarchical cluster analysis of RNA-Seq data derived from resting B cells (pooled from six normal donors), activated B cells (3 h, 24 h), GC B cells (two donors), and plasma cells (PC) relative to patients, measured as reads per kilobase of exon model per million mapped reads (RPKM) from RNA-Seq analysis. Heat map projections of selected NF-κB target genes (listed at right) are shown, including NF-κB signature genes (top; Davis et al., 2001). (D) Comparison of digital gene expression (RPKM) for selected NF-κB target genes listed at left.
Figure 5.
Figure 5.
Increased proliferation and altered function of patient B cells after stimulation. (A) Proliferation of naive B cells purified from patients and controls was measured by [3H]thymidine incorporation in response to various B cell–activating stimuli. Patient responses were significantly higher than controls for all stimuli (P < 0.03) except SAC. Data show mean ± standard deviation of triplicate wells. (B) Representative protein expression of three NF-κB–responsive surface markers (CD86, CD25, and CD83) was quantified in naive B cells by flow cytometry, before or after polyclonal stimulation with anti-IgM or SAC + 200 U/ml IL-2. MFI values are listed for each histogram shown. With the exception of SAC, patient responses were significantly higher than controls. (C) Purified naive B cells from a normal control donor (C1), P2, and P3 were stimulated with BAFF and IL-21 ± 1 µg/ml anti-CD40 Ab for 10 d. The percentage of IgDCD38hi plasma cells generated is highlighted in red for the lower right quadrant. (A–C) Data are representative of two (C) or three (A and B) independent experiments.
Figure 6.
Figure 6.
Patient T cells expressing mutant CARD11 are hyporesponsive to polyclonal stimulation. (A) Expression of CARD11 and p65 visualized by immunofluorescence and confocal microscopy in fixed resting T cells, quantified as described for Fig. 4 A. Insets in bottom row show individual cells from the same field. Bars: (top) 1 µm; (bottom) 10 µm. (B) Representative immunoblots of total T cell lysates prepared from normal donor controls (C1, C2, and C3) and patients for the indicated proteins. A separate matched control (C3) was compared with P4 for subsequent experiments. (C) Representative flow cytometric analysis of CD69 and CD25 measured ± stimulation with either soluble anti-CD3ε + anti-CD28 mAbs (blue lines) or bead-coupled anti-CD2/anti-CD3/anti-CD28 mAbs (red lines). MFI values are plotted at right in the corresponding color. (D) Calcium flux in purified resting T cells from controls (C1 and C2) and patients (P3 and P4) as measured by flow cytometry after stimulation with anti-CD3/anti-CD28 + 1 µg/ml protein A. Addition of ionomycin served as a positive control (bottom). (E) Western blot analysis of ERK and JNK phosphorylation relative to total ERK/JNK levels, after anti-CD3/anti-CD28 Ab stimulation of T cells cycling in IL-2. (F) Proliferation of resting T cells purified from patients and controls was measured by [3H]thymidine incorporation in counts per minute to stimuli described in C. Patient responses to soluble Ab stimulation were significantly lower than controls (P = 3.97 × 10⁻⁴). (G) IL-2 accumulation measured by ELISA in cell supernatants 4 d after stimulation as described in C. (H) Proliferation assay for purified control and P3 T cells stimulated with anti-CD3/CD28 Abs ± 100 U/ml of exogenous recombinant IL-2. (A and D–G) Data are representative of two (A, D, and E), three (F and G), or four (C) independent experiments. (A and F–H) Data show mean ± standard deviation of triplicate wells.
Figure 7.
Figure 7.
Ectopic overexpression of E127G CARD11 in normal T cells reduces magnitude of AgR-induced response. (A) Representative expression of endogenous or GFP-fused CARD11 in normal T cells transfected with empty vector (EV), WT, or E127G CARD11-GFP. (B) Representative flow cytometric analysis of CD69 expression on transfected cells stimulated as in Fig. 6 C. MFI values are listed for each histogram. (C) IL-2 secretion measured by ELISA in transfected cell supernatants 3 d after stimulation as described in Fig. 6 C. Data show mean ± standard deviation of triplicate wells. (D) Fold induction of CD69 expression and IL-2 secretion was calculated by normalizing CD69 MFI or IL-2 concentration in stimulated cells to unstimulated cells for each transfection. (E) Representative proliferation, as measured by dilution of CellTrace Violet dye, of unstimulated and bead-stimulated transfected T cells. The marker denotes the percentage of T cells that divided five to seven times. (B–E) Data are representative of two independent experiments.

References

    1. Blonska M., Joo D., Zweidler-McKay P.A., Zhao Q., Lin X. 2012. CARMA1 controls Th2 cell-specific cytokine expression through regulating JunB and GATA3 transcription factors. J. Immunol. 188:3160–3168 10.4049/jimmunol.1102943 - DOI - PMC - PubMed
    1. Boussiotis V.A., Freeman G.J., Griffin J.D., Gray G.S., Gribben J.G., Nadler L.M. 1994. CD2 is involved in maintenance and reversal of human alloantigen-specific clonal anergy. J. Exp. Med. 180:1665–1673 10.1084/jem.180.5.1665 - DOI - PMC - PubMed
    1. Carsetti R., Köhler G., Lamers M.C. 1995. Transitional B cells are the target of negative selection in the B cell compartment. J. Exp. Med. 181:2129–2140 10.1084/jem.181.6.2129 - DOI - PMC - PubMed
    1. Chappert P., Schwartz R.H. 2010. Induction of T cell anergy: integration of environmental cues and infectious tolerance. Curr. Opin. Immunol. 22:552–559 10.1016/j.coi.2010.08.005 - DOI - PMC - PubMed
    1. Darte J.M., McClure P.D., Saunders E.F., Weber J.L., Donohue W.L. 1971. Congenital lymphoid hyperplasia with persistent hyperlymphocytosis. N. Engl. J. Med. 284:431–432 10.1056/NEJM197102252840807 - DOI - PubMed

Publication types

MeSH terms