. 2012 Nov 19;209(12):2277-90.
doi: 10.1084/jem.20120350. Epub 2012 Nov 5.

Procontractile G protein-mediated signaling pathways antagonistically regulate smooth muscle differentiation in vascular remodeling

Affiliations

Procontractile G protein-mediated signaling pathways antagonistically regulate smooth muscle differentiation in vascular remodeling

Till F Althoff et al. J Exp Med. .

Abstract

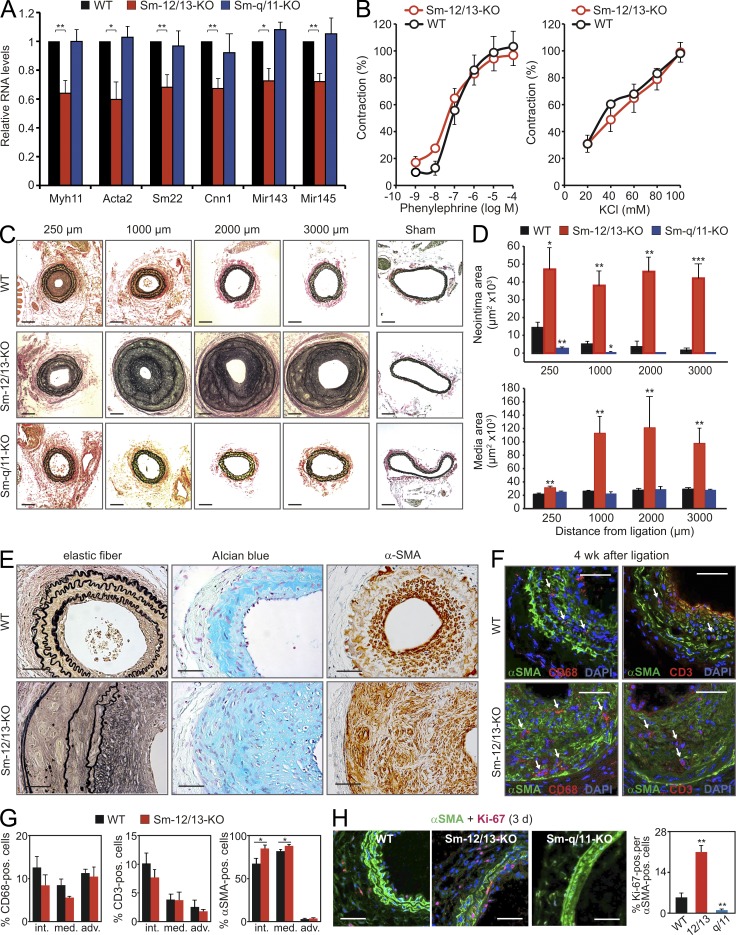
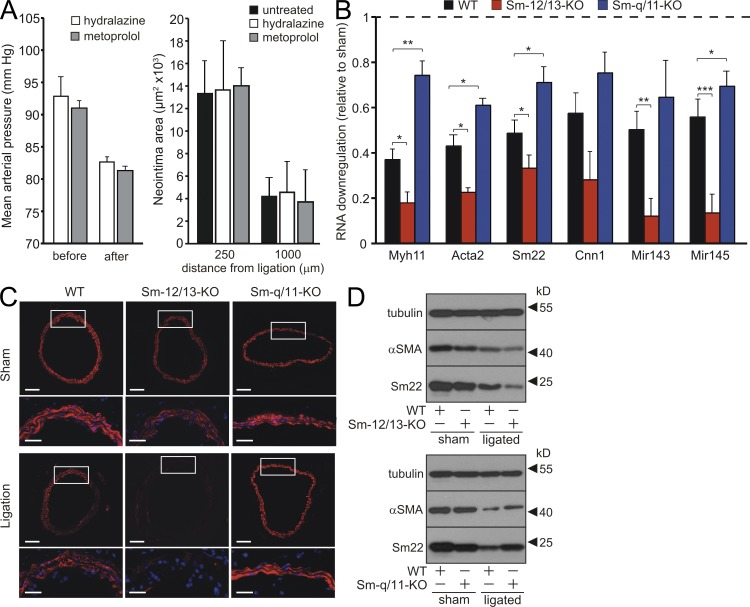
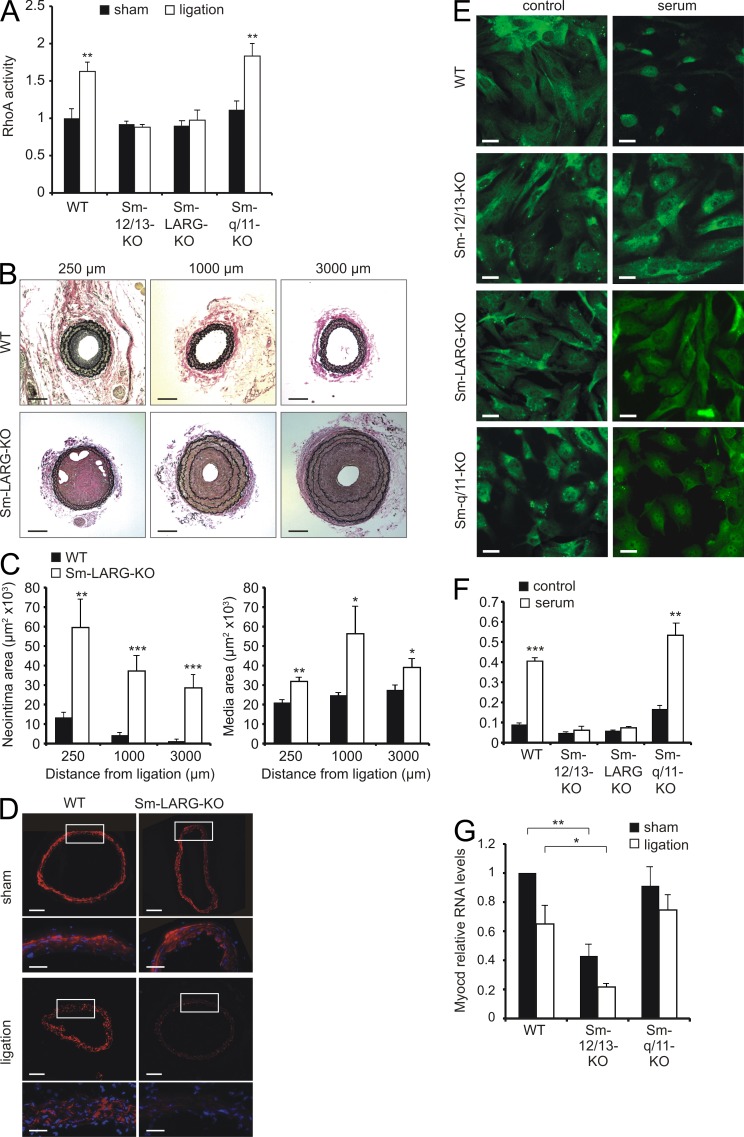
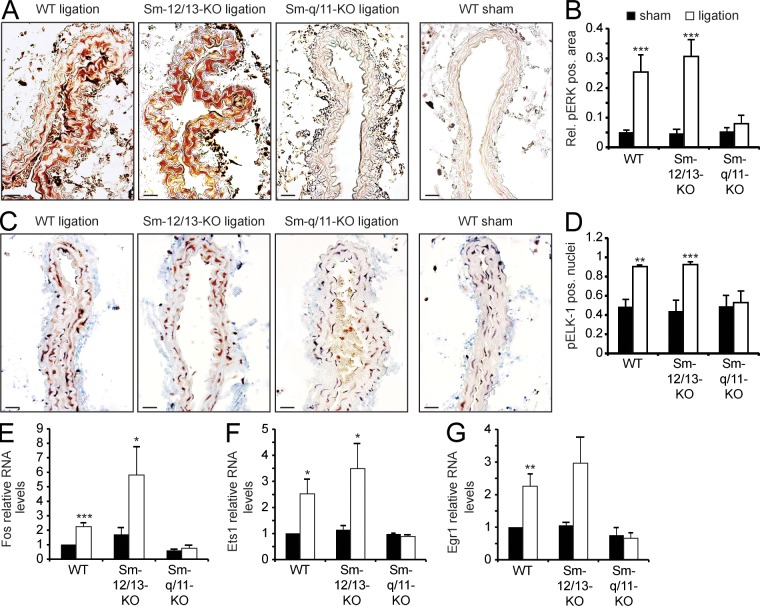
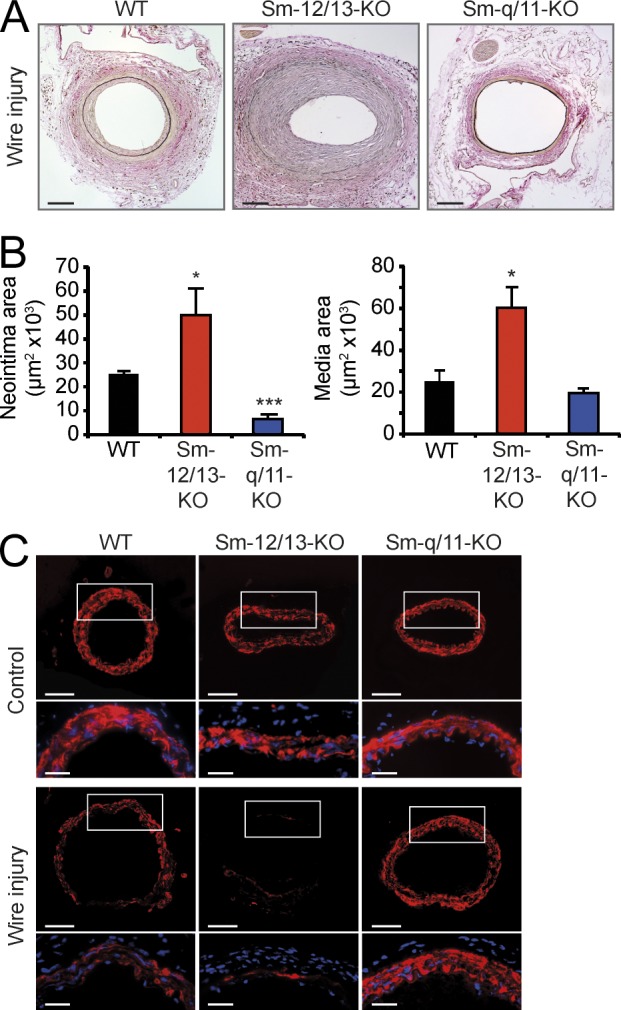
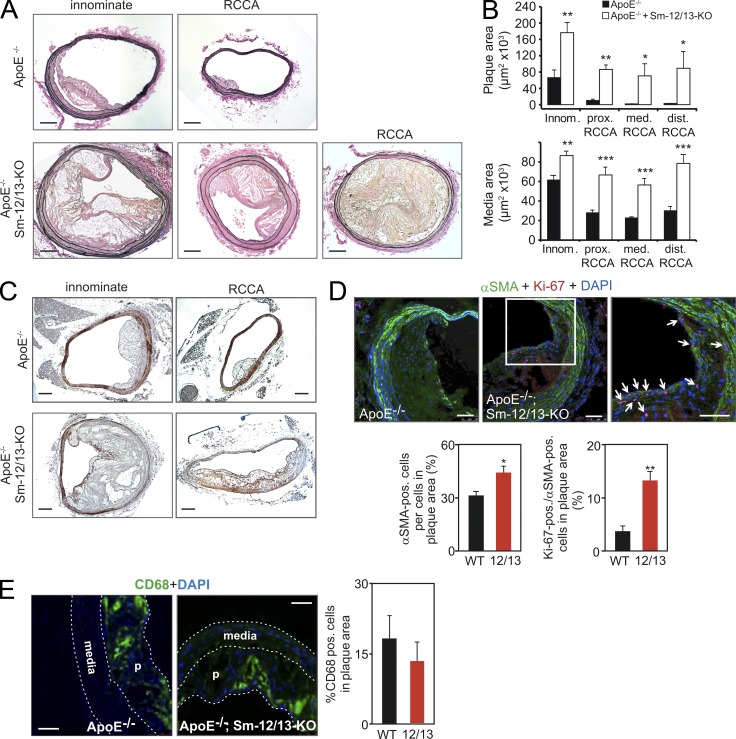
Vascular smooth muscle (Sm) cells (VSMCs) are highly plastic. Their differentiation state can be regulated by serum response factor (SRF), which activates genes involved in Sm differentiation and proliferation by recruiting cofactors, such as members of the myocardin family and ternary complex factors (TCFs), respectively. However, the extracellular cues and upstream signaling mechanisms regulating SRF-dependent VSMC differentiation under in vivo conditions are poorly understood. In this study, we show that the procontractile signaling pathways mediated by the G proteins G(12)/G(13) and G(q)/G(11) antagonistically regulate VSMC plasticity in different models of vascular remodeling. In mice lacking Gα(12)/Gα(13) or their effector, the RhoGEF protein LARG, RhoA-dependent SRF-regulation was blocked and down-regulation of VSMC differentiation marker genes was enhanced. This was accompanied by an excessive vascular remodeling and exacerbation of atherosclerosis. In contrast, Sm-specific Gα(q)/Gα(11) deficiency blocked activation of extracellular signal-regulated kinase 1/2 and the TCF Elk-1, resulting in a reduced VSMC dedifferentiation in response to flow cessation or vascular injury. These data show that the balanced activity of both G protein-mediated pathways in VSMCs is required for an appropriate vessel remodeling response in vascular diseases and suggest new approaches to modulate Sm differentiation in vascular pathologies.


Figures

Figure 1.
Figure 1.
Differential effects of Gq/G11 and G12/G13 on neointima formation. (A) Relative levels of mRNAs encoding Sm differentiation markers normalized against 18S and of miR143/miR145 normalized against 4.5S RNA in the media of carotid arteries from WT, Sm-Gα12/Gα13-KO (Sm-12/13-KO), or Sm-Gαq/Gα11-KO (Sm-q/11-KO) mice (the data are representative for five to six males and three independent experiments per group). Levels in the media of WT mice were set as 100%. (B) Effect of increasing concentration of phenylephrine or KCl on the vascular tone of carotid arteries from WT or Sm-12/13-KO mice in percentage of maximal response (the data are representative for four males and two independent experiments per group). (C and D) Analysis of carotid artery remodeling after ligation. (C) Shown are sections of the carotid arteries from WT, Sm-12/13-KO, and Sm-q/11-KO mice at a distance of 250, 1,000, 2,000, and 3,000 µm from the ligation site as well as sections of the contralateral vessel 4 wk after ligation. (D) The neointima and media areas in sections at the indicated distances from the ligation site were determined (the data are representative for five to seven males and three independent experiments per group). (E) Carotid arteries from WT and Sm-12/13-KO animals 4 wk after ligation were stained for elastic fibers (left), proteoglycans (middle), and α-SMA (right). Shown are representative sections (the data are representative for four to six males and two independent experiments per group). (F and G) Carotid arteries from WT and Sm-12/13-KO mice were immunostained 4 wk after ligation for CD68 and α-SMA or CD3 and α-SMA. Nuclei were counterstained with DAPI. Shown are representative images of stained sections (F) as well as the proportions of CD3-, α-SMA–, or CD68-positive cells in the intima (int.), media (media.), or adventitia (adv.; G; the data are representative for four to five males and two independent experiments per group). Arrows in F indicate CD68 (left)- or CD3 (right)-positive cells. (H) Carotid arteries from WT, Sm-12/13-KO (12/13), or Sm-q/11-KO mice (q/11) were stained 3 d after ligation for α-SMA and Ki-67. Shown are representative images as well as a statistical analysis of the percentage of Ki-67–positive cells among α-SMA–positive cells (the data are representative for four males and two independent experiments per group). Shown are mean values ± SEM; *, P < 0.05; **, P < 0.01; ***, P < 0.001 (compared with WT). Bars: (C) 100 µm; (E, F, and H) 50 µm.
Figure 2.
Figure 2.
Effects of Gαq/Gα11 and Gα12/Gα13 deficiency on SMC differentiation marker gene expression. (A) Effect of hydralazine- and metoprolol-induced hypotension on neointima formation after carotid ligation. WT mice were treated without or with 500 mg/liter hydralazine or 2.5 g/liter metoprolol in the drinking water resulting in a 10–15% reduction of the mean arterial blood pressure in the treated group compared with untreated animals. Shown are the mean arterial blood pressure values during 2 d before treatment (before) and during days 3 and 4 after the start of treatment (after) and an evaluation of the neointima areas in sections from untreated and treated animals at the indicated distances from the ligation site (n = 3). (B) Relative levels of mRNAs encoding Sm differentiation markers as well as of miR143/miR145 in the media of carotid arteries from WT, Sm-12/13-KO, and Sm-q/11-KO mice 3 d after carotid artery ligation relative to the levels in the media of the sham-operated contralateral vessel (n = 5–6). (C) Carotid artery sections at a distance of 1,000 µm from the ligation site from WT, Sm-12/13-KO, and Sm-q/11-KO mice 7 d after sham operation (sham) or carotid artery ligation stained with an anti–α-SMA antibody. White boxes indicate enlarged areas at the bottom of each image. (D) 3 d after sham operation or ligation, carotid arteries of WT, Sm-Gα12/Gα13-KO (Sm-12/13-KO), or Sm-Gαq/Gα11-KO (Sm-q/11-KO) were prepared free of adventitia and intima, and lysates were analyzed by immunoblotting using antibodies against α-SMA, Sm22, and tubulin. (A–D) Shown is one representative of at least three experiments. Shown are mean values ± SEM; *, P < 0.05; **, P < 0.01; ***, P < 0.001 (compared with WT). Bars: (C, bottom) 40 µm; (C, top) 100 µm.
Figure 3.
Figure 3.
VSMC differentiation via RhoA/LARG. (A) Relative RhoA activity in the media of carotid arteries from WT, Sm-12/13-KO, Sm-LARG-KO, and Sm-q/11-KO mice 24 h after sham operation or carotid artery ligation (the data are representative for four to six males and three independent experiments per group). (B and C) The left common carotid artery of WT and Sm-LARG-KO mice was ligated and analyzed. Shown are sections of the vessel (B) as well as the determination of the neointima and media areas (C) at a distance of 250, 1,000, and 3,000 µm from the ligation site (the data are representative for six males and three independent experiments per group). (D) Carotid arteries from WT or Sm-LARG-KO mice were analyzed 7 d after sham operation or carotid artery ligation, and sections at ∼1,000 µm from the ligation site were stained with an anti–α-SMA antibody. White boxes indicate enlarged areas at the bottom of each panel. (E and F) VSMCs from carotid arteries of WT, Sm-12/13-KO, Sm-LARG-KO, or Sm-q/11-KO mice were isolated, starved for 48 h, and then incubated in the absence or presence of 20% FBS for 1 h. Cells were fixed and stained with an anti–MRTF-A antibody (E), and the fraction of cells with nuclear MRTF-A staining was determined (F; the data are representative for four to six males and three independent experiments per group). (G) Relative levels of mRNA encoding myocardin (myocd) in the media of carotid arteries in WT, Sm-12/13-KO, and Sm-q/11-KO mice 3 d after sham operation carotid artery ligation (the data are representative for three to six males and twp independent experiments per group). Shown are mean values ± SEM; *, P < 0.05; **, P < 0.01; ***, P < 0.001 (compared with WT, sham, or –serum conditions, respectively). Bars: (B and D [top]) 100 µm; (D, bottom) 40 µm; (E) 5 µm.
Figure 4.
Figure 4.
Gq/G11-mediated signaling in VSMCs after carotid artery ligation. (A and B) 24 h after carotid artery ligation or sham operation, carotid arteries of WT, Sm-12/13-KO, or Sm-q/11-KO mice were isolated and sectioned. Shown are sections at a distance of 250–500 µm from the ligation site stained with an anti–phospho-Erk1/2 antibody (A), and the relative pERK-positive area was determined (n = 3–4; B). (C and D) 24 h after carotid artery ligation or sham operation, carotid arteries from WT, Sm-12/13-KO, or Sm-q/11-KO mice were isolated and sectioned. Shown are sections at a distance of 250–500 µm from the ligation site stained with an anti–phospho-Elk1 (pElk1) antibody and counterstained with hematoxylin (n = 3–4; C). (D) The percentage of pElk1-positive nuclei is shown. (E–G) 3 d after carotid artery ligation or sham operation of WT, Sm-12/13-KO, or Sm-q/11-KO mice, the media of carotid arteries was isolated, and the levels of mRNAs encoding Fos, Ets1, or Egr1 were determined. (A–G) Shown are mean values ± SEM (n = 3–6); *, P < 0.05; **, P < 0.01; ***, P < 0.001 (compared with sham). Shown is one representative of at least three experiments. Bars, 20 µm.
Figure 5.
Figure 5.
Effect of Sm-specific Gα deficiencies on vascular response to femoral artery injury. (A and B) 4 wk after femoral artery injury, femoral arteries from WT, Sm-12/13-KO, or Sm-q/11-KO mice were isolated and sectioned as described in Materials and methods. Shown are representative sections (A) and an evaluation of the neointima and media areas (n = 4; B). Shown are mean values ± SEM; *, P < 0.05; ***, P < 0.001 (compared with WT). (C) 7 d after femoral artery injury, femoral arteries from WT, Sm-12/13-KO, or Sm-q/11-KO mice were isolated. Shown are immunohistochemical analyses performed with an antibody against α-SMA. Boxes indicate magnified areas at the bottom of each panel. (A–C) Shown is one representative of at least three experiments. Bars: (A and C [top]) 100 µm; (C, bottom) 40 µm.
Figure 6.
Figure 6.
Increased plaque size in Sm-specific Gα12/Gα13-deficient mice lacking ApoE. (A and B) After 12 wk of a high-fat diet, the innominate and right common carotid arteries of ApoE−/− or ApoE−/−;SMMHC-CreERT2;Gα12−/−;Gα13flox/flox (ApoE−/−;Sm-12/13-KO) mice were isolated and analyzed histologically. (A) Shown are representative sections. (B) The plaque and media areas in animals of both genotypes were determined in innominate arteries at a distance of 1,000 µm from the aortic arch (innom.), in the right common carotid artery at a distance of 1,000 µm from the bifurcation of the innominate artery (prox. RCCA), at a distance of 1,000 µm from the bifurcation of the common carotid artery (dist. RCCA), or in between (med. RCCA; the data are representative for nine males and two independent experiments per group). (C) The innominate artery or right common carotid artery (RCCA) of ApoE−/− or ApoE−/−;Sm-12/13-KO mice was isolated and stained with an anti–α-SMA antibody. (D) Atherosclerotic plaques from ApoE−/− or ApoE−/−;Sm-12/13-KO mice were immunostained with antibodies against α-SMA and Ki-67. Shown are representative images. The right image is a magnification of the area indicated by the white box, and arrows point to α-SMA and Ki-67 double-positive cells. The bar graphs show a statistical evaluation of the number of α-SMA–positive cells per cells in the plaque area and the percentage of Ki-67–positive cells per α-SMA–positive cells in plaques from ApoE−/− (WT) and ApoE−/−;Sm-12/13-KO mice (12/13; the data are representative for four males and two independent experiments per group). (E) Sections of atherosclerotic plaques from ApoE−/− or ApoE−/−;Sm-12/13-KO mice were immunostained with antibodies against CD68. Shown are individual images counterstained with DAPI (media and plaques [p] are marked) as well as a bar graph showing the statistical evaluation of the percentage of CD68-positive cells in plaques of both groups of animals (the data are representative for six males and two independent experiments per group). Shown are mean values ± SEM; *, P < 0.05; **, P < 0.01; ***, P < 0.001. Bars: (A and C) 100 µm; (D and E) 50 µm.

References

    1. Andrawis N.S., Wang E., Abernethy D.R. 1996. Endothelin-1 induces an increase in total protein synthesis and expression of the smooth muscle alpha-actin gene in vascular smooth muscle cells. Life Sci. 59:523–528 10.1016/0024-3205(96)00332-3 - DOI - PubMed
    1. Cho H., Park C., Hwang I.Y., Han S.B., Schimel D., Despres D., Kehrl J.H. 2008. Rgs5 targeting leads to chronic low blood pressure and a lean body habitus. Mol. Cell. Biol. 28:2590–2597 10.1128/MCB.01889-07 - DOI - PMC - PubMed
    1. Chun J., Hla T., Lynch K.R., Spiegel S., Moolenaar W.H. 2010. International Union of Basic and Clinical Pharmacology. LXXVIII. Lysophospholipid receptor nomenclature. Pharmacol. Rev. 62:579–587 10.1124/pr.110.003111 - DOI - PMC - PubMed
    1. Copeland J.W., Treisman R. 2002. The diaphanous-related formin mDia1 controls serum response factor activity through its effects on actin polymerization. Mol. Biol. Cell. 13:4088–4099 10.1091/mbc.02-06-0092 - DOI - PMC - PubMed
    1. Dzau V.J., Braun-Dullaeus R.C., Sedding D.G. 2002. Vascular proliferation and atherosclerosis: new perspectives and therapeutic strategies. Nat. Med. 8:1249–1256 10.1038/nm1102-1249 - DOI - PubMed

Publication types

MeSH terms