

Genetic estimates of population age in the water flea, Daphnia magna
- PMID: 23129752
- PMCID: PMC3695665
- DOI: 10.1093/jhered/ess063
Genetic estimates of population age in the water flea, Daphnia magna
Abstract
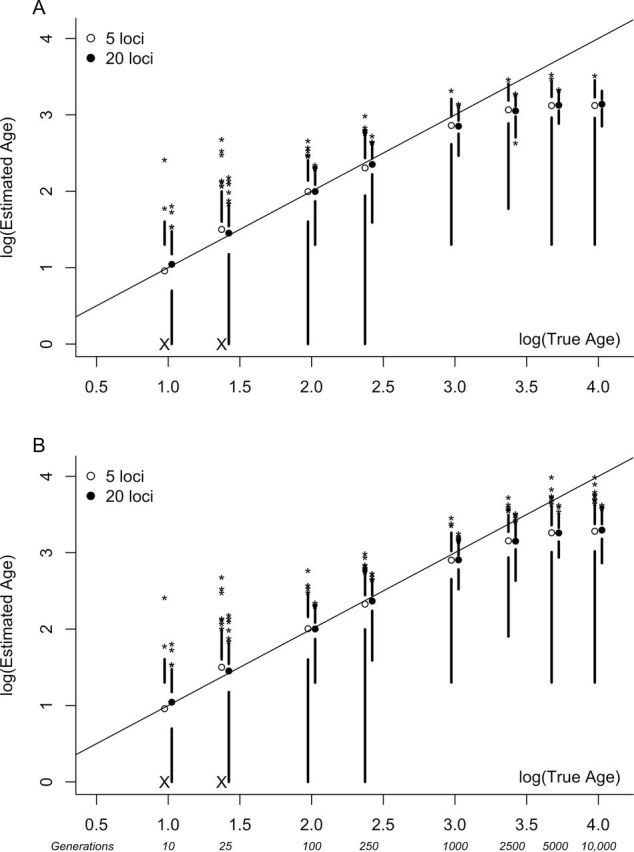
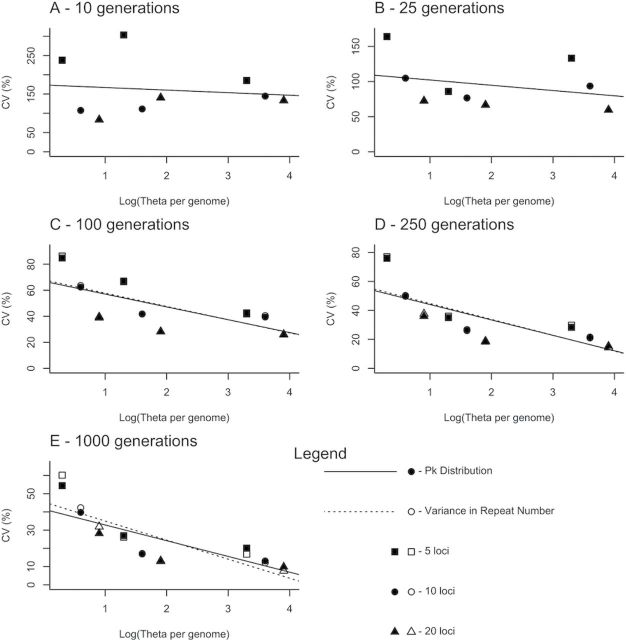
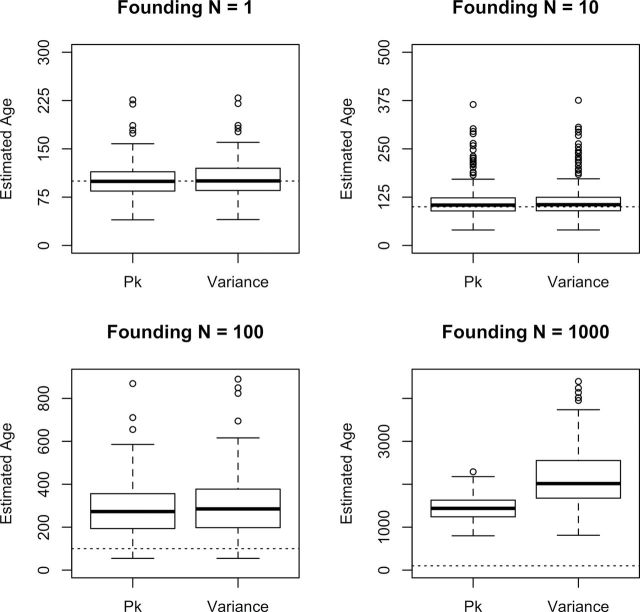
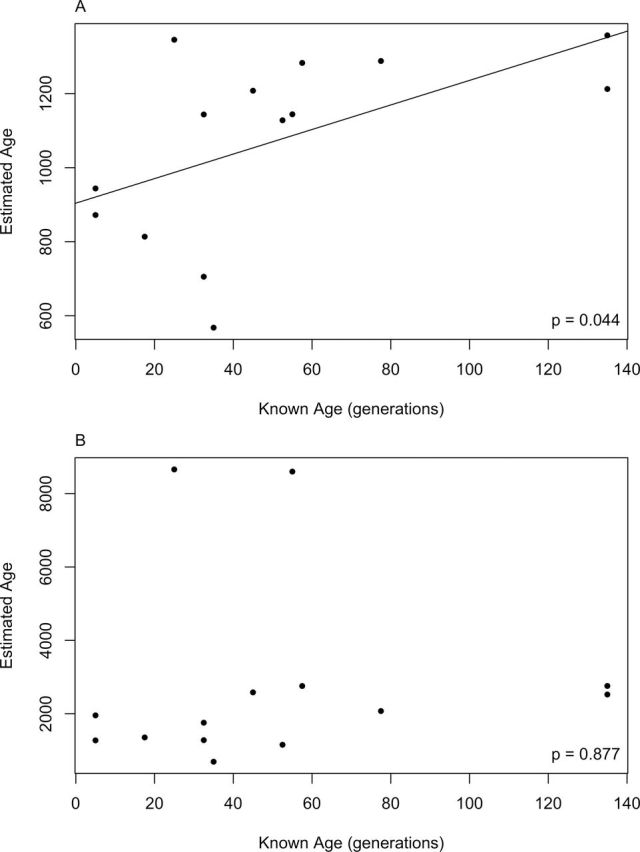
Genetic datasets can be used to date evolutionary events, even on recent time scales if sufficient data are available. We used statistics calculated from multilocus microsatellite datasets to estimate population ages in data generated through coalescent simulations and in samples from populations of known age in a metapopulation of Daphnia magna in Finland. Our simulation results show that age estimates improve with additional loci and define a time frame over which these statistics are most useful. On the most recent time scales, assumptions regarding the model of mutation (infinite sites vs. stepwise mutation) have little influence on estimated ages. In older populations, size homoplasy among microsatellite alleles results in a downwards bias for estimates based on the infinite sites model (ISM). In the Finnish D. magna metapopulation, our genetically derived estimated ages were biased upwards. Potential sources of this bias include the underlying model of mutation, gene flow, founder size, and the possibility of persistent source populations in the system. Our simulated data show that genetic age estimation is possible, even for very young populations, but our empirical data highlight the importance of factors such as migration when these statistics are applied in natural populations.
Figures
Similar articles
-
Approximate Bayesian estimation of extinction rate in the Finnish Daphnia magna metapopulation.Mol Ecol. 2013 May;22(10):2627-39. doi: 10.1111/mec.12283. Epub 2013 Apr 2. Mol Ecol. 2013. PMID: 23551417 Free PMC article.
-
Strong intraspecific variation in genetic diversity and genetic differentiation in Daphnia magna: the effects of population turnover and population size.Mol Ecol. 2012 Feb;21(4):851-61. doi: 10.1111/j.1365-294X.2011.05416.x. Epub 2012 Jan 4. Mol Ecol. 2012. PMID: 22221402
-
Intraspecific Variation in Microsatellite Mutation Profiles in Daphnia magna.Mol Biol Evol. 2019 Sep 1;36(9):1942-1954. doi: 10.1093/molbev/msz118. Mol Biol Evol. 2019. PMID: 31077327 Free PMC article.
-
Homoplasy and mutation model at microsatellite loci and their consequences for population genetics analysis.Mol Ecol. 2002 Sep;11(9):1591-604. doi: 10.1046/j.1365-294x.2002.01576.x. Mol Ecol. 2002. PMID: 12207711 Review.
-
Does genetic diversity limit disease spread in natural host populations?Heredity (Edinb). 2012 Oct;109(4):199-203. doi: 10.1038/hdy.2012.33. Epub 2012 Jun 20. Heredity (Edinb). 2012. PMID: 22713998 Free PMC article. Review.
Cited by
-
Intelligent high-throughput intervention testing platform in Daphnia.Aging Cell. 2022 Mar;21(3):e13571. doi: 10.1111/acel.13571. Epub 2022 Feb 23. Aging Cell. 2022. PMID: 35195332 Free PMC article.
-
Approximate Bayesian estimation of extinction rate in the Finnish Daphnia magna metapopulation.Mol Ecol. 2013 May;22(10):2627-39. doi: 10.1111/mec.12283. Epub 2013 Apr 2. Mol Ecol. 2013. PMID: 23551417 Free PMC article.
References
-
- Ally D, Ritland K, Otto S. 2008. Can clone size serve as a proxy for clone age? An exploration using microsatellite divergence in Populus tremuloides Mol Ecol. 17 4897–4911 - PubMed
-
- Altermatt F, Pajunen VI, Ebert D. 2008. Climate change affects colonization dynamics in a metacommunity of three Daphnia species Global Change Biol. 14 1209–1220
-
- Beerli P. 2006. Comparison of Bayesian and maximum-likelihood inference of population genetic parameters Bioinformatics. 22 341–345 - PubMed
-
- Bollen KA, Jackman R. 1990. Regression diagnostics: an expository treatment of outliers and influential cases.In: Fox J, Long JS., editors. Modern methods of data analysis Newbury Park (CA) Sage Publications.p. 257–291
Publication types
MeSH terms
Grants and funding
LinkOut - more resources
Full Text Sources
Other Literature Sources
