. 2013 Jan;33(2):252-64.
doi: 10.1128/MCB.00976-12. Epub 2012 Nov 5.

Fat body dSir2 regulates muscle mitochondrial physiology and energy homeostasis nonautonomously and mimics the autonomous functions of dSir2 in muscles

Affiliations

Fat body dSir2 regulates muscle mitochondrial physiology and energy homeostasis nonautonomously and mimics the autonomous functions of dSir2 in muscles

Kushal K Banerjee et al. Mol Cell Biol. 2013 Jan.

Erratum in

  • Mol Cell Biol. 2014 Jul;34(13):2547

Abstract

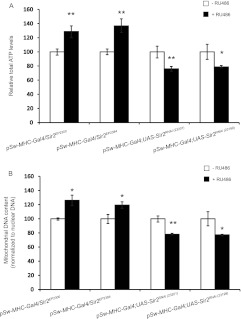
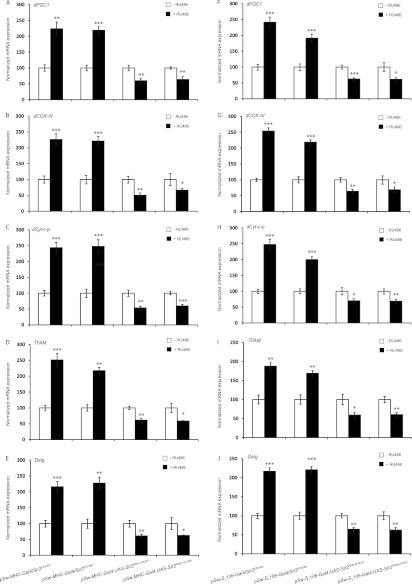
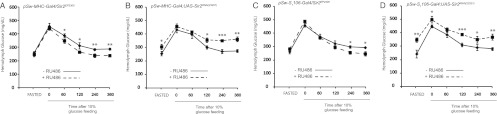
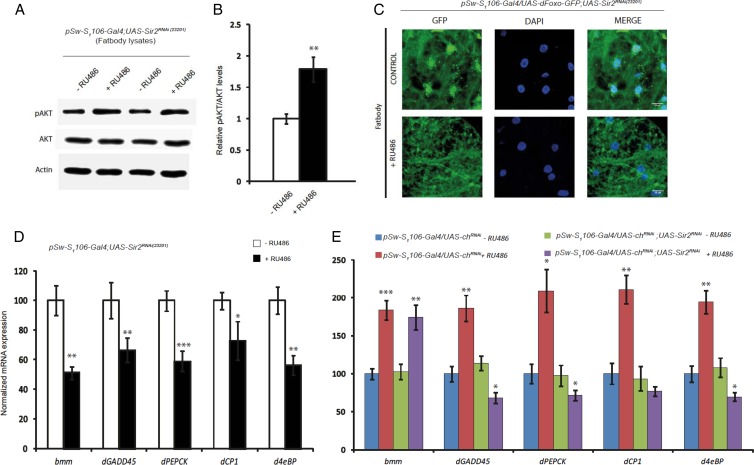
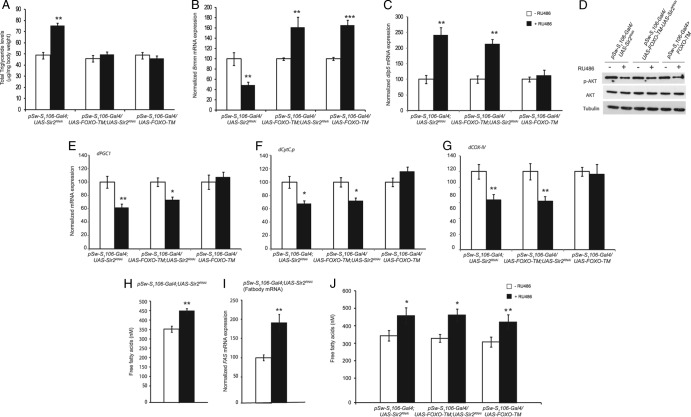
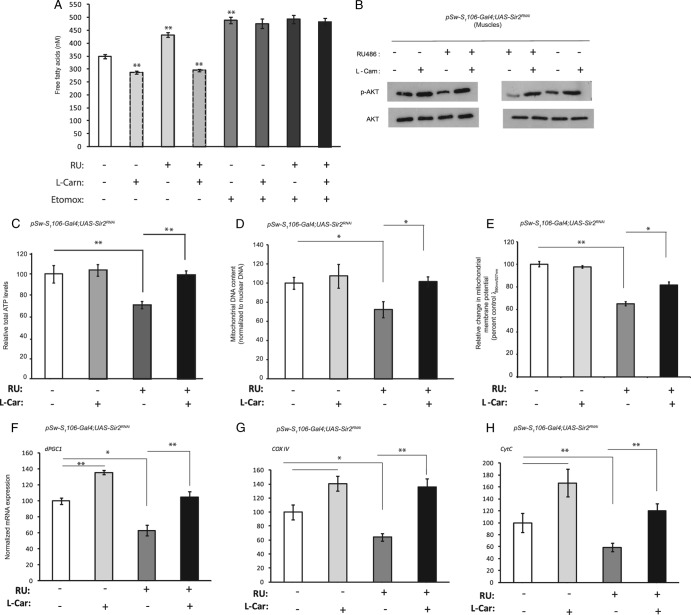
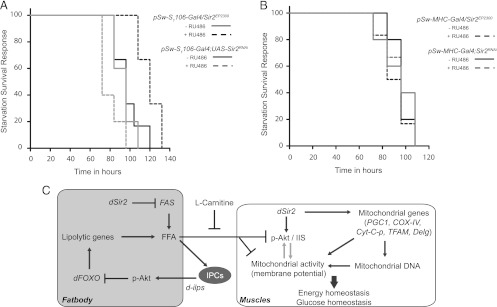
Sir2 is an evolutionarily conserved NAD(+)-dependent deacetylase which has been shown to play a critical role in glucose and fat metabolism. In this study, we have perturbed Drosophila Sir2 (dSir2) expression, bidirectionally, in muscles and the fat body. We report that dSir2 plays a critical role in insulin signaling, glucose homeostasis, and mitochondrial functions. Importantly, we establish the nonautonomous functions of fat body dSir2 in regulating mitochondrial physiology and insulin signaling in muscles. We have identified a novel interplay between dSir2 and dFOXO at an organismal level, which involves Drosophila insulin-like peptide (dILP)-dependent insulin signaling. By genetic perturbations and metabolic rescue, we provide evidence to illustrate that fat body dSir2 mediates its effects on the muscles via free fatty acids (FFA) and dILPs (from the insulin-producing cells [IPCs]). In summary, we show that fat body dSir2 is a master regulator of organismal energy homeostasis and is required for maintaining the metabolic regulatory network across tissues.


Figures

Fig 1
Fig 1
Muscle dSir2 regulates mitochondrial functions and energy homeostasis. Total ATP and mitochondrial DNA content were measured in muscle-specific dSir2 overexpression, mdSir2OE (pSw-MHC-Gal4/Sir2EP2300 and pSw-MHC-Gal4/Sir2EP2384), and knockdown, mdSir2KD [pSw-MHC-Gal4; Sir2RNAi(23201) and pSw-MHC-Gal4; Sir2RNAi(23199)], flies. (A) Normalized total ATP levels in mdSir2OE and mdSir2KD flies. (B) Mitochondrial DNA content (normalized to nuclear DNA content) in mdSir2OE and mdSir2KD flies. All the assays were done on muscle samples. Sample sizes were 36 flies for the ATP assay and 24 flies for the measurement of mtDNA. Control, −RU486; overexpression/knockdown, +RU486 (200 μM). All data are shown as means ± standard errors of the means. *, P < 0.05; **, P < 0.01.
Fig 2
Fig 2
Fat body dSir2 nonautonomously regulates muscle mitochondrial functions and energy homeostasis. Total ATP, mitochondrial DNA content, and mitochondrial membrane potential were measured in fat body-specific dSir2 overexpression, fbdSir2OE (pSw-S1106-Gal4/Sir2EP2300 and pSw-S1106-Gal4/Sir2EP2384), and knockdown, fbdSir2KD [pSw-S1106-Gal4; UAS-Sir2RNAi(23201) and pSw-S1106-Gal4; UAS-Sir2RNAi(23199)], flies. (A) Normalized total ATP levels in fbdSir2OE and fbdSir2KD flies. (B) Mitochondrial DNA content (normalized to nuclear DNA content) in fbdSir2OE and fbdSir2KD flies. (C) Mitochondrial membrane potential as measured using JC-1 staining and confocal microscopy as detailed in Materials and Methods in fbdSir2OE and fbdSir2KD flies. All the assays were done on muscle samples. Sample sizes were 36 flies for the ATP assay and 24 flies for the measurement of mtDNA. For measurement of mitochondrial membrane potential and microscopy, four flies were used, and a total of 90 stacks were imaged and quantified using ImageJ. Control, −RU486; overexpression/knockdown, +RU486 (200 μM). All data are shown as means ± standard errors of the means. *, P < 0.05; **, P < 0.01.
Fig 3
Fig 3
Muscle and fat body dSir2 regulate the expression of nuclear genes for mitochondrial proteins in the muscles in an autonomous and nonautonomous manner, respectively. As indicated, relative mRNA expression levels of dPGC1, dCyt.C-p, dCOX-IV, TFAM, and Delg in the muscle samples of mdSir2OE (pSw-MHC-Gal4/Sir2EP2300 and pSw-MHC-Gal4/Sir2EP2384) and mdSir2KD [pSw-MHC-Gal4; UAS-Sir2RNAi(23201) and pSw-MHC-Gal4; UAS-Sir2RNAi(23199)] flies (A to E) and of fbdSir2OE (pSw-S1106-Gal4/Sir2EP2300 and pSw-S1106-Gal4/Sir2EP2384) and fbdSir2KD [pSw-S1106-Gal4; UAS-Sir2RNAi(23201) and pSw-S1106-Gal4; UAS-Sir2RNAi(23199)] (F to J) flies. Sample size, 60 flies. Control, −RU486; overexpression/knockdown, +RU486 (200 μM). All data are shown as means ± standard errors of the means. *, P < 0.05; **, P < 0.01; ***, P < 0.001.
Fig 4
Fig 4
Insulin signaling in the muscles is regulated autonomously as well as nonautonomously by dSir2. (A to C) Muscle-specific dSir2 overexpression (pSw-MHC-Gal4/Sir2EP2300, or mdSir2OE): phospho-AKT levels in muscle samples (A), ratio of p-Akt/Akt in these samples (B), and relative mRNA expression levels of dilp-2 and -5 in head samples (C). (D to F) Muscle-specific dSir2 knockdown (pSw-MHC-Gal4; Sir2RNAi, or mdSir2KD): phospho-AKT levels in muscle samples (D), ratio of p-Akt/Akt in these samples (E), and relative mRNA expression levels of dilp-2 and -5 in head samples (F). (G to I) Fat body-specific dSir2 overexpression (pSw-S1106-Gal4/Sir2EP2300, or fbdSir2OE): phospho-AKT levels in muscle samples (G), ratio of p-Akt/Akt in these samples (H), and relative mRNA expression levels of dilp-2 and -5 in head samples (I). (J to L) Fat body-specific dSir2 knockdown (S1106-Gal4; UAS-Sir2RNAi, or fbdSir2KD): phospho-AKT levels in muscle samples (J), ratio of p-Akt/Akt in these samples (K), and relative mRNA expression levels of dilp-2 and -5 in head samples (L). Sample sizes were 16 flies for phospho-AKT, Akt, and actin levels per loading and 24 flies for measurement of dilp mRNA expression. Control, −RU486; overexpression/knockdown, +RU486 (200 μM). All data are shown as means ± standard errors of the means. **, P < 0.01; ***, P < 0.001.
Fig 5
Fig 5
dSir2 in the fat body and muscles regulates glucose homeostasis. An oral glucose tolerance test (oGTT) was performed using hemolymph isolated from pSw-MHC-Gal4/Sir2EP2300 (mdSir2OE) (A), pSw-MHC-Gal4; UAS-Sir2RNAi (mdSir2KD) (B), pSw-S1106-Gal4/Sir2EP2300 (fbdSir2OE) (C), and pSw-S1106-Gal4; UAS-Sir2RNAi (fbdSir2KD) (D) flies. For every time point, 5 samples from hemolymph isolated from 12 flies each were used. Control, −RU486; overexpression/knockdown, +RU486 (200 μM). All data are shown as means ± standard errors of the means. *, P < 0.05; **, P < 0.01; ***, P < 0.001.
Fig 6
Fig 6
Fat body dSir2 regulates dFOXO localization and activity in an insulin-dependent manner. Phospho-AKT levels in fat body samples of pSw-S1106-Gal4; UAS-Sir2RNAi (fbdSir2KD) flies (A) and the ratio of p-Akt/Akt in these samples are shown (B). (C) dFOXO-GFP localization in the fat bodies of control and fbdSir2KD flies. (D and E) Relative mRNA expression levels of brummer (bmm), dGADD45, dPEPCK, Cathepsin-L (dCPl), and d4eBP in the fat bodies of pSw-S1106-Gal4; UAS-Sir2RNAi, pSw-S1106-Gal4/UAS-ChRNAi, and pSw-S1106-Gal4/UAS-chRNAi; UAS-Sir2RNAi flies with relevant controls (n = 24 flies for measurement of mRNA expression). Control, −RU486; overexpression/knockdown, +RU486 (200 μM). All data are shown as means ± standard errors of the means. Images were captured using a Zeiss 510 metaconfocal microscope at a magnification of ×63. *, P < 0.05; **, P < 0.01; ***, P < 0.001.
Fig 7
Fig 7
Fat body dFOXO-TM overexpression in the absence of dSir2 rescues triglyceride levels but not muscle insulin signaling defects. As indicated on the figure, data are for fat body-specific dSir2 knockdown (pSw-S1106-Gal4; UAS-Sir2RNAi), fat body-specific overexpression of dFOXO-TM (pSw-S1106-Gal4/UAS-dFOXO-TM), and simultaneous fat body-specific knockdown and overexpression of dSir2 and dFOXO-TM (pSw-S1106-Gal4/UAS-FOXO-TM; UAS-Sir2RNAi). (A) Total triglyceride levels. (B) Expression of brummer lipase. (C) Relative expression of dilp-5 in head sample. (D) p-Akt levels in muscle samples. Relative mRNA expression levels of dPGC1 (E), dCyt.C-p (F), and dCOX-IV (G) in muscle samples are shown. (H and J) Circulating free fatty acid levels. (I) Relative mRNA expression of fatty acid synthase in the fat body. Sample sizes were 16 flies for phospho-AKT levels and 60 flies for analysis of the expression levels of genes. For free fatty acid measurement eight sets with five flies were used. Control, −RU486; overexpression/knockdown, +RU486 (200 μM or 400 μM, for driving single or double UAS genes). All data are shown as means ± standard errors of the means. *, P < 0.05; **, P < 0.01; ***, P < 0.001.
Fig 8
Fig 8
l-Carnitine rescues the defects in muscle physiology associated with fat body-specific knockdown of dSir2. Fat body-specific dSir2 knockdown (pSw-S1106-Gal4; UAS-Sir2RNAi or fbdSir2KD) flies were treated or not treated with 25 mg/ml l-carnitine for 24 h and with 25 μM etomoxir for 12 h. Circulating free fatty acid levels (A), phospho-AKT levels (B), total ATP levels (C), mtDNA content (D), and mitochondrial membrane potential (E) were determined. (F to H) Relative mRNA expression levels of dPGC1, dCOX-IV, and dCyt.C-p, as indicated. Sample size, eight sets each with 5 flies for free fatty acid measurement, 24 flies for measurement of phospho-AKT levels, and 36 flies for total ATP levels. Mitochondrial membrane potential was measured using JC-1 staining using four flies. In total, 90 stacks were imaged and quantified by ImageJ. Control, −RU486; overexpression/knockdown, +RU486 (200 μM). All data are shown as means ± standard errors of the means. *, P < 0.05; **, P < 0.01.
Fig 9
Fig 9
dSir2 in the fat body is a key factor in maintaining metabolic regulatory network in the organism with consequences on survival. (A and B) Starvation survival of fat body-specific dSir2 overexpression, fbdSir2OE (pSw-S1106-Gal4/Sir2EP2300), and knockdown, fbdSir2KD (pSw-S1106-Gal4; UAS-Sir2RNAi), flies (A) and muscle-specific dSir2 overexpression, mdSir2OE (pSw-MHC-Gal4/Sir2EP2300), and knockdown, mdSir2KD (pSw-MHC-Gal4; UAS-Sir2RNAi), flies (B). Control, −RU486; overexpression/knockdown, +RU486 (200 μM). For survival analyses a Mantel-Cox log rank test was used, and the statistical significance was as follows: P = 0.0039 for fbdSir2OE and the control, P = 0.049 for fbdSir2KD and the control, and P was nonsignificant for both mdSir2OE and the control and for mdSir2KD and the control. (C) Schematic indicating the functions of dSir2 on organismal physiology. dSir2 in the muscle is sufficient to regulate mitochondrial functions and glucose homeostasis. The ability of dSir2 to maintain organismal physiology is elicited by its functions in the fat body (liver-equivalent tissue). Fat body dSir2-dependent changes in free fatty acids (FFA) might influence dilp production in the IPCs, which impinges on insulin signaling. dilp/IIS-dependent regulation of dFOXO activity affects lipid homeostasis in the fat body. We hypothesize that an absence of dSir2 in the fat body leads to elevated FFA, thus resulting in a metabolic stress condition in muscles. This manifests as a prediabetic state, which is associated with reduced insulin signaling and mitochondrial dysfunctions in the muscle. Metabolic intervention using l-carnitine rescues this phenotype and supports the mechanistic insights into dSir2-dependent alterations in energy homeostasis.

References

    1. Cheng Z, Tseng Y, White MF. 2010. Insulin signaling meets mitochondria in metabolism. Trends Endocrinol. Metab. 21:589–598 - PMC - PubMed
    1. Marshall S. 2006. Role of insulin, adipocyte hormones, and nutrient-sensing pathways in regulating fuel metabolism and energy homeostasis: a nutritional perspective of diabetes, obesity, and cancer. Sci. STKE 2006:re7 doi:10.1126/stke.3462006re7 - DOI - PubMed
    1. Taguchi A, White MF. 2008. Insulin-like signaling, nutrient homeostasis, and life span. Annu. Rev. Physiol. 70:191–212 - PubMed
    1. Muoio DM, Neufer PD. 2012. Lipid-induced mitochondrial stress and insulin action in muscle. Cell Metab. 15:595–605 - PMC - PubMed
    1. Banerjee KK, Ayyub C, Sengupta S, Kolthur-Seetharam U. 2012. dSir2 deficiency in the fat body, but not muscles, affects systemic insulin signaling, fat mobilization and starvation survival in flies. Aging 4:206–223 - PMC - PubMed

Publication types

MeSH terms