. 2012 Feb;1(1):27-41.
doi: 10.1161/JAHA.111.000125. Epub 2012 Feb 20.

Effector Memory T cells Are Associated With Atherosclerosis in Humans and Animal Models

Affiliations

Effector Memory T cells Are Associated With Atherosclerosis in Humans and Animal Models

Enrico Ammirati et al. J Am Heart Assoc. 2012 Feb.

Abstract

BACKGROUND#ENTITYSTARTX02014;: Adaptive T-cell response is promoted during atherogenesis and results in the differentiation of naïve CD4(+)T cells to effector and/or memory cells of specialized T-cell subsets. Aim of this work was to investigate the relationship between circulating CD4(+)T-cell subsets and atherosclerosis. METHODS AND RESULTS#ENTITYSTARTX02014;: We analyzed 57 subsets of circulating CD4(+)T cells by 10-parameter/8-color polychromatic flow cytometry (markers: CD3/CD4/CD45RO/CD45RA/CCR7/CCR5/CXCR3/HLA-DR) in peripheral blood from 313 subjects derived from 2 independent cohorts. In the first cohort of subjects from a free-living population (n=183), effector memory T cells (T(EM): CD3(+)CD4(+)CD45RA(-)CD45RO(+)CCR7(-) cells) were strongly related with intima-media thickness of the common carotid artery, even after adjustment for age (r=0.27; P<0.001). Of note, a significant correlation between T(EM) and low-density lipoproteins was observed. In the second cohort (n=130), T(EM) levels were significantly increased in patients with chronic stable angina or acute myocardial infarction compared with controls. HLA-DR(+)T(EM) were the T(EM) subpopulation with the strongest association with the atherosclerotic process (r=0.37; P<0.01). Finally, in animal models of atherosclerosis, T(EM) (identified as CD4(+)CD44(+)CD62L(-)) were significantly increased in low-density lipoprotein receptor and apolipoprotein E deficient mice compared with controls and were correlated with the extent of atherosclerotic lesions in the aortic root (r=0.56; P<0.01). CONCLUSIONS#ENTITYSTARTX02014;: Circulating T(EM) cells are associated with increased atherosclerosis and coronary artery disease in humans and in animal models and could represent a key CD4(+)T-cell subset related to the atherosclerotic process. (J Am Heart Assoc. 2012;1:27-41.).

Keywords: C-c chemokine receptor type 7; atherosclerosis; chemokines; coronary artery disease; effector memory T cells.


Figures

Figure 1.
Figure 1.
CD4+T cells subsets: properties and potential role in atherosclerosis.
Figure 2.
Figure 2.
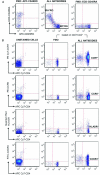
Identification of positive stained cells using the Fluorescence Minus One (FMO) strategy. To appropriately identify positive stained cells and differentiate them from background autofluorescence for gate inclusion, we used the FMO strategy. The background nonspecific fluorescence is collected in the detector assigned to the missing antibody in FMO control. FMO controls are samples that include all the conjugated antibodies but one. The channel for the missing conjugated antibody is that of the FMO gating control. FMO controls are important for setting thresholds in cell populations that express a continuous spectrum of numbers of receptors (such as CD45RO, CD45RA, CCR7, CCR5, HLA-DR, and CXCR3) and allows to better define the positive cell population in comparison with unstained cells. In fact, although unstained cell populations are centered close to zero, their width can vary depending on autofluorescence and spillover corrections in different channels. In (A), the plot on the left the antibody CD45RO-APC conjugated is missing and in the plot on the right the antibody CD45RA-ECD conjugated is missing. In this way, it is possible to correctly define the thresholds of CD45RO positive and CD45RO positive cells in the plot in the center. In (B), the same procedure for the other antibodies used in our experiments. The unstained populations are presented to assess the difference with the positive threshold identified with FMO.
Figure 3.
Figure 3.
Gating strategy to identify the principal CD4+T-cell subsets, and some of the T-cell subpopulations. Color dot plot of a representative subject. Lymphocytes were identified and electronically gated on orthogonal light scatter signals and CD3 immunopositivity (approximately 30.000 events on CD3 for each sample) (A). Then CD3+CD4+T cells were identified (B). Gating on CD3+CD4+T cells, memory T cells (TM) were identified as CD45RA negative and CD45RO positive (C). In (D), the expression of the chemokine receptor CCR-7 was shown in CD3+T cells. In (E), the expression of CCR7 defined the naïve T cells (TN) as CD45RA+CD45RO and CCR7 positive. In (F), the expression of CCR7 is used to define central memory T cells (TCM; CCR7 positive) and effector memory T cells (TEM; CCR7 negative). In (G), it is shown the different expression of chemokine receptors CXCR3, CCR5, and marker of activation HLA-DR in CD3+CD4+CCR7+ T cells, in TN, in TCM and in TEM. TEM have a relative increased expression of markers of activation and chemokine receptors in comparison with other T-cell subsets. In G are shown some of the T-cell subpopulations that are considered in further analysis (such as CXCR3+TEM, CCR5+TEM, HLA-DR+TEM).
Figure 4.
Figure 4.
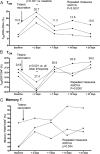
Effector memory T cell (TEM), central memory T cell (TCM), and memory T cell variations at several time points after tetanic vaccination in three healthy subjects. Dots represent subject and continuous lines show the temporal changes between the first sampling (before the tetanic vaccination) and the following ones at several time point after the antigen exposure (after 2, 7, 14, and 21 days). We observed a temporally limited increase in levels of TEM and a reciprocal decrease in levels of TCM at 2 days after antigen exposure with a subsequent decrease of TEM and increase of TCM to prevaccination levels after 1 and 3 weeks after the exposure. Means percentage are reported and referred to the total number of CD3+CD4+T cells (A, B). A trend vs a significant increase in total memory T cells have been observed after 2 to 3 weeks from tetanic vaccination (C).
Figure 5.
Figure 5.
Effector memory T cells (TEM) levels are increased in patients with coronary artery disease (CAD). Representative color dot plots from a control and patients with different CAD manifestations: CSA, chronic stable angina; AMI, acute myocardial infarction (A). Significant increases in TEM levels were observed in patients with CSA and AMI in comparison with controls. There were no significant difference in levels of TEM between CSA and AMI. Kruskall-Wallis and Dunn's test were performed. Dots represent individual patient data; dashed lines show median value and continuous lines show 25th and 75th percentiles (B).
Figure 6.
Figure 6.
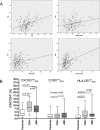
Effector memory T-cell (TEM) subpopulations correlate with intima-media thickness (IMT) and are increased in patients with coronary artery disease (CAD). The correlation between IMT and TEM, CXCR3+TEM, HLA-DR+TEM, and CCR5+TEM is shown in A to D (see Methods Section for details). (E) The percentage of CXCR3+TEM, HLA-DR+TEM, and CCR5+TEM in patients with chronic stable angina (CSA, n = 30) or acute myocardial infarction (AMI, n = 60) and controls (n = 40). The Kruskal-Walli test with Dunn's comparison for all groups was used.
Figure 7.
Figure 7.
Effector memory (TEM) levels are increased in animal models of atherosclerosis. Representative color dot plots from wild-type (C57BL/6J) animals fed a chow diet, a cholesterol rich (western type, WT) diet and from LDL receptor (LDL-R), and apolipoprotein E (Apo-E) knockout animals are shown in (A), while the percentages of circulating naïve T cells (TN: in mouse defined as CD62L+CD44), central memory T cells (TCM: CD62L+CD44+), and memory effector T cells (TEM: CD62LCD44) are shown in (B) (n = 12; 3 for each group) (*P<0.05 vs C57Bl/6J chow diet; °P<0.05 vs C57Bl/6J WT diet, pairwise test with Bonferroni correction). The correlations between circulating levels of TN, TCM, and TEM and atherosclerotic plaque area at the aortic sinus are shown in panel C (n = 12; 3 for each group, Spearman correlation coefficients are shown).

Comment in

  • J Am Heart Assoc. 1(1):3.

Similar articles

Cited by

References

    1. Libby P, Ridker PM, Maseri A. Inflammation and atherosclerosis. Circulation. 2002;105:1135–1143. - PubMed
    1. Hansson GK, Hermansson A. The immune system in atherosclerosis. Nat Immunol. 2011;12:204–212. - PubMed
    1. Hansson GK. Inflammation, atherosclerosis, and coronary artery disease. N Engl J Med. 2005;352:1685–1695. - PubMed
    1. Zernecke A, Weber C. Chemokines in the vascular inflammatory response of atherosclerosis. Cardiovasc Res. 2010;86:192–201. - PubMed
    1. Hermansson A, Ketelhuth DF, Strodthoff D, Wurm M, Hansson EM, Nicoletti A, Paulsson-Berne G, Hansson GK. Inhibition of T cell response to native low-density lipoprotein reduces atherosclerosis. J Exp Med. 2010;207:1081–1093. - PMC - PubMed