

A simple new visualization of exercise data discloses pathophysiology and severity of heart failure
- PMID: 23130146
- PMCID: PMC3487328
- DOI: 10.1161/JAHA.112.001883
A simple new visualization of exercise data discloses pathophysiology and severity of heart failure
Abstract
Background: The complexity of cardiopulmonary exercise testing data and their displays tends to make assessment of patients, including those with heart failure, time consuming.
Methods and results: We postulated that a new single display that uses concurrent values of oxygen uptake / ventilation versus carbon dioxide output / ventilation ratios ([Formula: see text]-versus-[Formula: see text]), plotted on equal X-Y axes, would better quantify normality and heart failure severity and would clarify pathophysiology. Consecutive [Formula: see text]-versus-[Formula: see text] values from rest to recovery were displayed on X-Y axes for patients with Class II and IV heart failure and for healthy subjects without heart failure. The displays revealed distinctive patterns for each group, reflecting sequential changes in cardiac output, arterial and mixed venous O(2) and CO(2) content differences, and ventilation ([Formula: see text]). On the basis of exercise tests of 417 healthy subjects, reference formulas for highest [Formula: see text] and [Formula: see text], which normally occur during moderate exercise, are presented. Absolute and percent predicted values of highest [Formula: see text] and [Formula: see text] were recorded for 10 individuals from each group: Those of healthy subjects were significantly higher than those of patients with Class II heart failure, and those of patients with Class II heart failure were higher than those of patients with Class IV heart failure. These values differentiated heart failure severity better than peak [Formula: see text], anaerobic threshold, peak oxygen pulse, and [Formula: see text] slopes. Resting [Formula: see text]-versus-[Formula: see text] values were strikingly low for patients with Class IV heart failure, and with exercise, increased minimally or even decreased. With regard to the pathophysiology of heart failure, high [Formula: see text] values during milder exercise, previously attributed to ventilatory inefficiency, seem to be caused primarily by reduced cardiac output rather than increased [Formula: see text].
Conclusion: [Formula: see text]-versus-[Formula: see text] measurements and displays, extractable from future or existing exercise data, separate the 3 groups (healthy subjects, patients with Class II heart failure, and patients with Class IV heart failure) well and confirm the dominant role of low cardiac output rather than excessive [Formula: see text] in heart failure pathophysiology. (J Am Heart Assoc. 2012;1:e001883 doi: 10.1161/JAHA.112.001883.).
Keywords: cardiac output; exercise; heart failure; oxygen; ventilation.
Figures
 –versus–
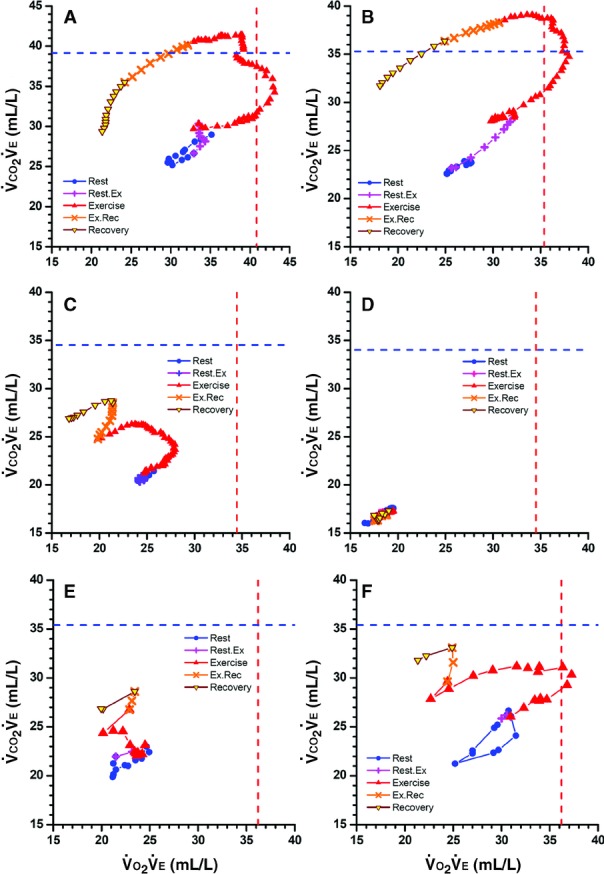
 ) during cardiopulmonary exercise testing from rest through early recovery, with “+” and “×” showing transitions between rest and exercise and exercise and recovery. Vertical and horizontal dashed lines are reference highest
  and highest
  . A, Healthy 38-year-old man with peak
  106% of predicted. B, Healthy 52-year-old woman with peak
  101% of predicted. Note that with exercise, both numerators increase more than denominators until reaching highest
  and then highest
  before rapid declines, especially in
  values, during high-intensity exercise and recovery. C, Fifty-seven-year-old woman (NYHA Class II) with moderate left heart failure, oscillatory breathing, and peak
  63% of predicted. The shape of the early exercise pattern is reasonable, but the highest
  and
and  are well below normal. The rise in
  during the transition to recovery is abnormal. D, Seventy-three-year-old man (NYHA class IV) with peak
  21% of predicted who died several weeks later. All values are very low. The resting, exercise, and recovery values overlay each other and on magnification can be seen to oscillate. Immediate movement to the lower left at the onset of exercise is an ominous pattern. E and F, Left heart failure in 64-year-old man before and after treatment. Raw data were obtained every 30 s rather than 10 s. In E, values move to the left (
 is decreasing) and upward with exercise. After treatment, peak
  values increased from 45% to 66% of predicted. In F, resting values start higher and move upward and to the right (indicating
  is also increasing) before moving leftward. In both studies, the highest
  occurred when
  ≈21 L/min, at which time
  was 25×21=≈520 mL/min (E) and
  was 370×21=≈780 mL/min (F). Thus, this 50% increase in
  from E to F was primarily due to increased perfusion, not increased ventilation.
Similar articles
-
Exercise Ventilation in COPD: Influence of Systolic Heart Failure.COPD. 2016 Dec;13(6):693-699. doi: 10.1080/15412555.2016.1174985. Epub 2016 May 12. COPD. 2016. PMID: 27172093
-
Excess Ventilation in Chronic Obstructive Pulmonary Disease-Heart Failure Overlap. Implications for Dyspnea and Exercise Intolerance.Am J Respir Crit Care Med. 2017 Nov 15;196(10):1264-1274. doi: 10.1164/rccm.201704-0675OC. Am J Respir Crit Care Med. 2017. PMID: 28665692
-
Emphysema on Thoracic CT and Exercise Ventilatory Inefficiency in Mild-to-Moderate COPD.COPD. 2017 Apr;14(2):210-218. doi: 10.1080/15412555.2016.1253670. Epub 2016 Dec 20. COPD. 2017. PMID: 27997255
-
Ventilatory Inefficiency and Exertional Dyspnea in Early Chronic Obstructive Pulmonary Disease.Ann Am Thorac Soc. 2017 Jul;14(Supplement_1):S22-S29. doi: 10.1513/AnnalsATS.201612-1033FR. Ann Am Thorac Soc. 2017. PMID: 28345959 Review.
-
Mechanisms That Modulate Peripheral Oxygen Delivery during Exercise in Heart Failure.Ann Am Thorac Soc. 2017 Jul;14(Supplement_1):S40-S47. doi: 10.1513/AnnalsATS.201611-889FR. Ann Am Thorac Soc. 2017. PMID: 28679061 Review.
Cited by
-
Usefulness of decrease in oxygen uptake efficiency to identify gas exchange abnormality in patients with idiopathic pulmonary arterial hypertension.PLoS One. 2014 Jun 6;9(6):e98889. doi: 10.1371/journal.pone.0098889. eCollection 2014. PLoS One. 2014. PMID: 24905576 Free PMC article.
-
Functional Data Analysis for Predicting Pediatric Failure to Complete Ten Brief Exercise Bouts.IEEE J Biomed Health Inform. 2022 Dec;26(12):5953-5963. doi: 10.1109/JBHI.2022.3206100. Epub 2022 Dec 7. IEEE J Biomed Health Inform. 2022. PMID: 36103443 Free PMC article.
-
Cardiopulmonary exercise capacity and preoperative markers of inflammation.Mediators Inflamm. 2014;2014:727451. doi: 10.1155/2014/727451. Epub 2014 Jun 26. Mediators Inflamm. 2014. PMID: 25061264 Free PMC article.
-
The Role of Cardiopulmonary Exercise Testing for Decision Making in Patients with Repaired Tetralogy of Fallot.Pediatr Cardiol. 2017 Aug;38(6):1097-1105. doi: 10.1007/s00246-017-1656-z. Epub 2017 Jun 16. Pediatr Cardiol. 2017. PMID: 28623384 Review.
-
Effect of Zhan Zhuang Qigong on upper limb static tremor and aerobic exercise capacity in patients with mild-to-moderate Parkinson's disease: study protocol for a randomised controlled trial.BMJ Open. 2022 Jul 12;12(7):e059625. doi: 10.1136/bmjopen-2021-059625. BMJ Open. 2022. PMID: 35820757 Free PMC article.
References
-
- Mancini DM, Eisen H, Kussmaul W, Mull R, Edmunds LH, Jr, Wilson JR. Value of peak exercise oxygen consumption for optimal timing of cardiac transplantation in ambulatory patients with heart failure. Circulation. 1991;83:778-786 - PubMed
-
- Stevenson LW, Steimle AE, Fonarow G, Kermani M, Kermani D, Hamilton MA, Moraguchi JD, Walden J, Tillisch JH, Drinkwater DC. Improvement in exercise capacity of candidates awaiting heart transplantation. J Am Coll Cardiol. 1995;25:163-170 - PubMed
-
- Myers J, Gullestad L, Vagelos R, Do D, Bellin D, Ross H, Fowler MB. Clinical, hemodynamic, and cardiopulmonary exercise test determinants of survival in patients referred for evaluation of heart failure. Ann Intern Med. 1998;129:286-293 - PubMed
-
- Balady GJ, Arena R, Sietsema K, Myers J, Coke L, Fletcher GF, Froman D, Franklin B, Guazzzi M, Gulati M, Keteyian SJ, Lavie CJ, Macko R, Mancini D, Milani RV. American Heart Association Exercise, Cardiac Rehabilitation, and Prevention Committee of the Council on Clinical Cardiology, Council on Epidemiology and Prevention, Council on Peripheral Vascular Disease, Interdisciplinary Council on Quality of Care and Outcomes Research Clinician's guide to cardiopulmonary exercise testing in adults: a scientific statement from the American Heart Association. Circulation. 2010;122:191-225 - PubMed
-
- Older P, Hall A, Hader R. Cardiopulmonary exercise testing as a screening test for perioperative management of major surgery in the elderly. Chest. 1999;116:355-362 - PubMed
LinkOut - more resources
Full Text Sources
