. 2012 Aug;1(4):e000992.
doi: 10.1161/JAHA.112.000992. Epub 2012 Aug 24.

Arginase II Promotes Macrophage Inflammatory Responses Through Mitochondrial Reactive Oxygen Species, Contributing to Insulin Resistance and Atherogenesis

Affiliations

Arginase II Promotes Macrophage Inflammatory Responses Through Mitochondrial Reactive Oxygen Species, Contributing to Insulin Resistance and Atherogenesis

Xiu-Fen Ming et al. J Am Heart Assoc. 2012 Aug.

Abstract

Background: Macrophage-mediated chronic inflammation is mechanistically linked to insulin resistance and atherosclerosis. Although arginase I is considered antiinflammatory, the role of arginase II (Arg-II) in macrophage function remains elusive. This study characterizes the role of Arg-II in macrophage inflammatory responses and its impact on obesity-linked type II diabetes mellitus and atherosclerosis.

Methods and results: In human monocytes, silencing Arg-II decreases the monocytes' adhesion to endothelial cells and their production of proinflammatory mediators stimulated by oxidized low-density lipoprotein or lipopolysaccharides, as evaluated by real-time quantitative reverse transcription-polymerase chain reaction and enzyme-linked immunosorbent assay. Macrophages differentiated from bone marrow cells of Arg-II-deficient (Arg-II(-/-)) mice express lower levels of lipopolysaccharide-induced proinflammatory mediators than do macrophages of wild-type mice. Importantly, reintroducing Arg-II cDNA into Arg-II(-/-) macrophages restores the inflammatory responses, with concomitant enhancement of mitochondrial reactive oxygen species. Scavenging of reactive oxygen species by N-acetylcysteine prevents the Arg-II-mediated inflammatory responses. Moreover, high-fat diet-induced infiltration of macrophages in various organs and expression of proinflammatory cytokines in adipose tissue are blunted in Arg-II(-/-) mice. Accordingly, Arg-II(-/-) mice reveal lower fasting blood glucose and improved glucose tolerance and insulin sensitivity. Furthermore, apolipoprotein E (ApoE)-deficient mice with Arg-II deficiency (ApoE(-/-)Arg-II(-/-)) display reduced lesion size with characteristics of stable plaques, such as decreased macrophage inflammation and necrotic core. In vivo adoptive transfer experiments reveal that fewer donor ApoE(-/-)Arg-II(-/-) than ApoE(-/-)Arg-II(+/+) monocytes infiltrate into the plaque of ApoE(-/-)Arg-II(+/+) mice. Conversely, recipient ApoE(-/-)Arg-II(-/-) mice accumulate fewer donor monocytes than do recipient ApoE(-/-)Arg-II(+/+) animals.

Conclusions: Arg-II promotes macrophage proinflammatory responses through mitochondrial reactive oxygen species, contributing to insulin resistance and atherogenesis. Targeting Arg-II represents a potential therapeutic strategy in type II diabetes mellitus and atherosclerosis. (J Am Heart Assoc. 2012;1:e000992 doi: 10.1161/JAHA.112.000992.).

Keywords: atherosclerosis; diabetes mellitus, type 2; inflammation; macrophages.


Figures

Figure 1.
Figure 1.
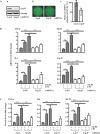
Upregulation of Arg‐II but not of Arg‐I in response to inflammatory activation and differentiation of monocytes/macrophages. A, The murine macrophage cell line RAW264.7 was stimulated with LPS (0.1 μg/mL) for the indicated time points (hours). The expression of iNOS, Arg‐I, and Arg‐II was detected by Western blot. Protein lysates of murine liver (Li) and kidney (Ki) were used as positive controls for Arg‐I and Arg‐II, respectively. Representative blots from 3 independent experiments are shown. The graphs below the blots present the quantification of the signals. Values are medians, and error bars represent 25th and 75th percentiles. The Kruskal‐Wallis test with Dunn's multiple‐comparison post‐test was performed. *P<0.05, **P<0.01 vs control. B and C, The human monocyte cell line THP‐1 was either (B) activated with LPS (0.1 mg/mL, 22 h) or (C) differentiated into macrophages with PMA (phorbol 12‐myristate 13‐acetate; 0.2 μmol/mL, 3 days).
Figure 2.
Figure 2.
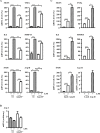
Silencing Arg‐II suppressed proinflammatory functions of human monocytes. A, Silencing Arg‐II in THP‐1 monocytes decreased monocyte adhesion onto activated endothelial cells. THP‐1 cells were transduced with rAd/U6‐LacZshRNA as control or with rAd/U6‐hArg‐IIshRNA. Experiments were performed at day 4 after transduction. A‐a, Immunoblotting revealed the efficient knockdown of Arg‐II expression. A‐b, Representative images of THP‐1 adhesion onto TNFα‐activated endothelial cells. A‐c, Quantification of the signals in A‐b from 5 independent experiments. Values are medians, and error bars represent 25th and 75th percentiles. HUVEC indicates human umbilical vein endothelial cells. The Mann‐Whitney test was used. B and C, Silencing Arg‐II in human monocytes decreased the expression of proinflammatory genes. THP‐1 cells were transduced with rAd/U6‐LacZshRNA as control or with rAd/U6‐hArg‐IIshRNA. At day 4 after transduction, cells were serum‐starved in 0.2% BSA‐RPMI for 6 or 22 h, followed by stimulation with oxLDL (50 μg/mL) or LPS (0.1 μg/mL) for 24 or 8 h, respectively. Extracted RNA and conditioned medium were then subjected to qRT‐PCR (B) and enzyme‐linked immunosorbent assay (C) analysis, respectively. Data shown are mean±SEM from 6 independent experiments. *P<0.05, **P<0.01, and ***P<0.001 between the indicated groups.
Figure 3.
Figure 3.
Targeted disruption of Arg‐II suppressed proinflammatory functions of macrophages, and reintroduction of Arg‐II into macrophages from Arg‐II−/− mice restored proinflammatory responses ex vivo. A and B, qRT‐PCR analysis of LPS‐induced (0.1 μg/mL, 22 h) mRNA expression of proinflammatory mediators and Arg‐II (A) as well as Arg‐I (B) in bone marrow–derived macrophages from wild‐type (wt) and Arg‐II−/− mice. Experiments were performed on day 7 after differentiation ex vivo. Cells were serum‐starved for 6 h before addition of LPS. Data are mean±SEM from 12 (untreated groups) or 6 (LPS‐treated groups) individual animals. C, Macrophages differentiated from the bone marrow cells of Arg‐II−/− mice were transduced with rAd/CMV‐LacZ as control or with rAd/CMV‐Arg‐II at day 6 after differentiation ex vivo. Two days after transduction, cells were serum‐starved for 6 h, stimulated with LPS (0.1 μg/mL, 22 h), and subjected to qRT‐PCR analysis. Data shown are mean±SEM from 5 individual animals. *P<0.05, **P<0.01, and ***P<0.001 between the indicated groups.
Figure 4.
Figure 4.
Inhibition of iNOS with L‐NAME affected LPS‐induced production of only IL6 but not of any other proinflammatory mediators in macrophages. qRT‐PCR analysis of LPS‐induced (0.1 μg/mL, 22 h) mRNA expression of proinflammatory mediators in the absence or presence of the NOS inhibitor L‐NAME (5 mmol/L) in bone marrow–derived macrophages from wild‐type mice. Nontreated cells were used as control (C). Experiments were performed on day 7 after differentiation ex vivo. Cells were serum‐starved for 4 h before addition of L‐NAME (pretreatment for 2 h), followed by addition of LPS. Data shown are mean±SEM from 10 individual animals. *P<0.05, **P<0.01, and ***P<0.001 vs control or between indicated groups.
Figure 5.
Figure 5.
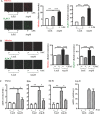
Arg‐II promoted macrophage proinflammatory responses through mitochondrial oxidative stress. A, Bone marrow–derived macrophages were transduced and treated exactly as in Figure 3C and then were subjected to MitoSox or H2DCF staining for detection of mitochondrial O2•− or H2O2 levels, respectively. Shown are representative images of experiments performed in macrophages from 5 individual animals. The corresponding bar graphs show the quantification of the relative fluorescence intensity normalized by cell number. Data shown are mean±SEM. B, Bone marrow–derived macrophages from Arg‐II−/− mice were transduced with rAd/CMV‐LacZ as control or with rAd/CMV‐Arg‐II at day 6 after differentiation ex vivo. One day after transduction, cells were treated with NAC (5 mmol/L, 24 h) and then subjected to ROS detection with MitoSox or H2DCF staining. Shown are representative images of experiments performed in macrophages from 6 individual animals. The corresponding bar graphs show the quantification of the relative fluorescence intensity normalized by cell number. Data are mean±SEM. C, Bone marrow–derived macrophages from Arg‐II−/− mice were transduced as described in B. NAC (5 mmol/L) was added 12 h after transduction, and cells were incubated for a further 60 h. Cells were serum‐starved in 0.2% BSA‐RPMI during the last 24 h in the absence or presence of NAC as indicated. Total RNA was extracted 72 h after transduction and was subjected to qRT‐PCR analysis. Data shown are mean±SEM from 8 individual animals. Scale bar=50 μm. *P<0.05, **P<0.01, and ***P<0.001 between the indicated groups.
Figure 6.
Figure 6.
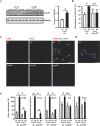
Targeted disruption of Arg‐II suppressed macrophage inflammation in obesity‐linked insulin resistance / type II diabetes mellitus. A, Immunoblotting analysis of Arg‐II expression in peritoneal macrophages of wild‐type (wt) mice fed NC or HF diet. Bar graph shows the quantification of the immunoblots. n=8, *P<0.05 between the 2 groups. B, Quantification of the adhesion assay performed with peritoneal macrophages from 4 different mouse groups as indicated. Data shown are mean±SEM obtained with 5 (NC group) or 6 (HF group) individual mice. HUVEC indicates human umbilical vein endothelial cells. C, Representative confocal images of macrophage infiltration in epididymal fat as assessed by immunofluorescence staining of the paraffin‐embedded sections with antibodies against the pan‐macrophage marker F4/80 (red) and the proinflammatory macrophage marker CD11c (green), followed by nuclei counterstaining with DAPI (blue). Images of F4/80 (left), CD11c (middle), and merged (right) are shown. Scale bar=250 μm. D, Enlargement of the inset in C. Scale bar=50 μm. E, qRT‐PCR analysis of mRNA expression of the inflammatory markers in epididymal fat tissue. Data shown are mean±SEM from 5 (NC group) to 7 (HF group) individual animals. *P<0.05, **P<0.01 between the indicated groups.
Figure 7.
Figure 7.
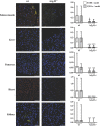
Targeted disruption of Arg‐II suppressed systemic macrophage inflammation in the HF‐induced obesity‐associated insulin resistance mouse model. Representative photos of macrophage infiltration into various tissues, as assessed by confocal immunofluorescence staining of the paraffin‐embedded sections with antibodies against the pan‐macrophage marker F4/80 (red) and the proinflammatory macrophage marker CD11c (green), followed by nuclei counterstaining with DAPI (blue). Shown are the representative merged images from 7 to 11 individual animals of each group. Scale bar=50 μm. Quantification of macrophage infiltration is expressed as a ratio of F4/80‐ or CD11c‐positive cells to tissue nuclei number and is presented in the corresponding graphs on the right. Values are medians, and error bars represent 25th and 75th percentiles. Mann‐Whitney test was used. *P<0.05, **P<0.01, and ***P<0.001 vs wild‐type (wt).
Figure 8.
Figure 8.
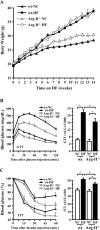
Improved glucose tolerance and insulin sensitivity in Arg‐II−/− mice. A, Growth curve of wild‐type (wt) and Arg‐II−/− mice on NC or HF diets. GTT (B) and ITT (C) in lean and obese wild‐type and Arg‐II−/− mice. Data shown are mean±SEM from 14 to 19 individual animals. Area under the curve (AUC) is presented in the corresponding graphs on the right. *P<0.05 between the indicated groups.
Figure 9.
Figure 9.
Blood parameters of wild‐type (wt) and Arg‐II−/− mice fed NC (n=9) or HF (n=17 or 18) diets for 14 weeks. Plasma samples were prepared after 14 weeks of HF diet that started at the age of 7 weeks and after 6‐h daytime food withdrawal.*P<0.05, **P<0.01, and ***P<0.001 between indicated groups.
Figure 10.
Figure 10.
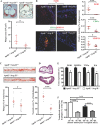
Targeted disruption of Arg‐II reduced atherosclerosis in ApoE−/− mice. Mice were fed either HF (A and B) or HC (C, D, and E) diet for 10 weeks. A, Representative images showing Oil Red O staining of plaques in aortic roots of ApoE−/−Arg‐II+/+ and ApoE−/−Arg‐II−/− mice. Quantifications of the lesions are presented in the graph below the stains. Data shown are medians with 25th and 75th percentiles from 8 animals of each group. At least 7 equally spaced cryosections of aortic roots per mouse were evaluated. B, Representative confocal microscopic images showing macrophage accumulation in the lesions stained with antibodies against F4/80 (red), or CD11c (green) and MMP14 (red). All sections were counterstained with DAPI (blue). The merged images are shown. Scale bars=10 μm. Quantifications of the positive stained cells are presented in the corresponding graphs on the right. Data shown are medians with 25th and 75th percentiles from 8 animals of each group. C, Representative images of Oil Red O staining of lesions in thoracic‐abdominal aortas. Quantifications of the lesions are shown in the graph below the stain (n=18 of each group). D, Hematoxylin‐eosin staining of aortic arches of the 2 mouse groups. Quantifications of necrotic core (indicated by #) are presented as percentage of the cell‐free area to the total lesion area and are shown in the graph below the stain (n=10). At least 4 equally spaced sections per mouse were evaluated. E, qRT‐PCR analysis of F4/80, MMP14, TNFα, and IL6 in the plaques isolated from aortic arches. Data shown are mean±SEM from 10 animals of each group. F, In vivo adoptive transfer. Labeled monocytes from donor ApoE−/−Arg‐II+/+ (sk: groups 1 and 2) and ApoE−/−Arg‐II−/− (dk: groups 3 and 4) mice were injected into recipient ApoE−/−Arg‐II+/+ (groups 1 and 3: sk→sk and dk→sk, respectively) and ApoE−/−Arg‐II−/− (groups 2 and 4: sk→dk and dk→dk, respectively) mice. Data are presented as percentage change to the sk→sk control group. The number of fluorescent macrophages counted in atherosclerotic lesions of the control group (sk→sk) is 61.29±11.46 (n=7 for groups 1 and 3; n=6 for groups 2 and 4). *P<0.05; ***P<0.001 between the indicated groups.

Similar articles

Cited by

References

    1. Olefsky JM, Glass CK. Macrophages, inflammation, and insulin resistance. Annu Rev Physiol. 2010;72:219-246 - PubMed
    1. Patsouris D, Li PP, Thapar D, Chapman J, Olefsky JM, Neels JG. Ablation of CD11c‐positive cells normalizes insulin sensitivity in obese insulin resistant animals. Cell Metab. 2008;8:301-309 - PMC - PubMed
    1. Wentworth JM, Naselli G, Brown WA, Doyle L, Phipson B, Smyth GK, Wabitsch M, O'Brien PE, Harrison LC. Pro‐inflammatory CD11c+CD206+ adipose tissue macrophages are associated with insulin resistance in human obesity. Diabetes. 2010;59:1648-1656 - PMC - PubMed
    1. Ross R. Atherosclerosis—an inflammatory disease. N Engl J Med. 1999;340:115-126 - PubMed
    1. Swirski FK, Libby P, Aikawa E, Alcaide P, Luscinskas FW, Weissleder R, Pittet MJ. Ly‐6Chi monocytes dominate hypercholesterolemia‐associated monocytosis and give rise to macrophages in atheromata. J Clin Invest. 2007;117:195-205 - PMC - PubMed