

A novel surface electrocardiogram-based marker of ventricular arrhythmia risk in patients with ischemic cardiomyopathy
- PMID: 23130163
- PMCID: PMC3487358
- DOI: 10.1161/JAHA.112.001552
A novel surface electrocardiogram-based marker of ventricular arrhythmia risk in patients with ischemic cardiomyopathy
Abstract
Background: Better sudden cardiac death risk markers are needed in ischemic cardiomyopathy (ICM). Increased heterogeneity of electrical restitution is an important mechanism underlying the risk of ventricular arrhythmia (VA). Our aim was to develop and test a novel quantitative surface electrocardiogram-based measure of VA risk in patients with ICM: the Regional Restitution Instability Index (R2I2).
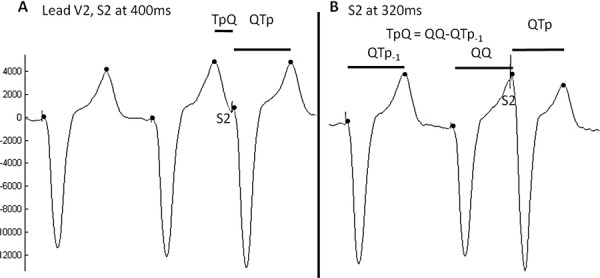
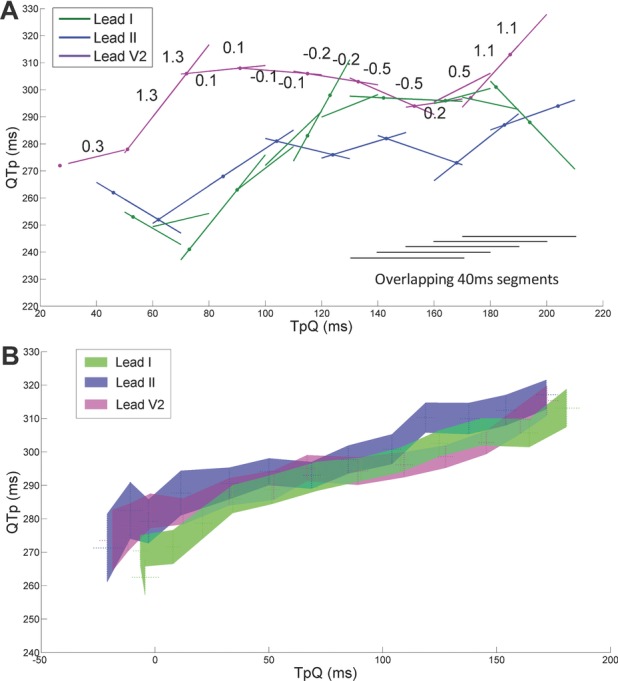
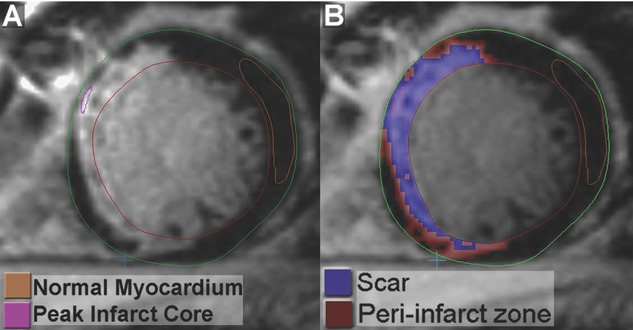
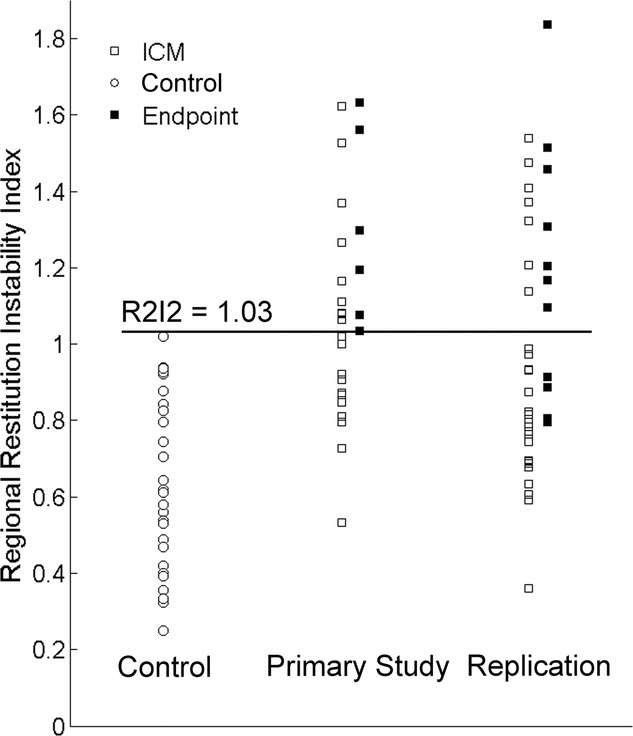
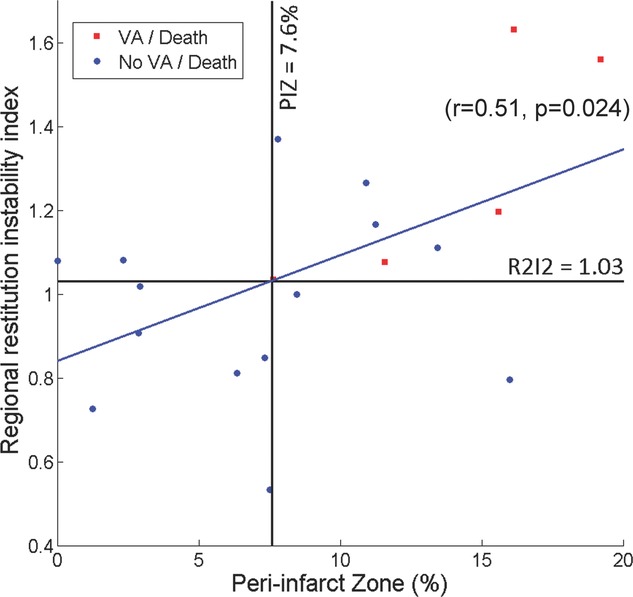
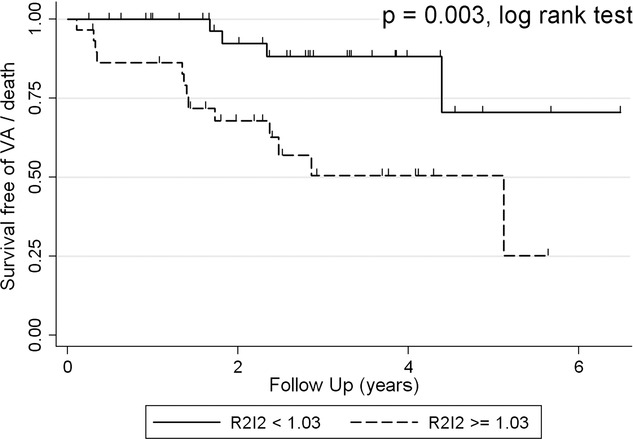
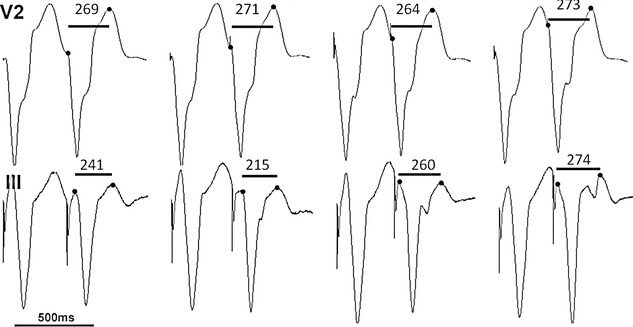
Methods and results: R2I2, the mean of the standard deviation of residuals from the mean gradient for each ECG lead at a range of diastolic intervals, was measured retrospectively from high-resolution 12-lead ECGs recorded during an electrophysiology study. Patient groups were as follows: Study group, 26 patients with ICM being assessed for implantable defibrillator; Control group, 29 patients with supraventricular tachycardia undergoing electrophysiology study; and Replication group, 40 further patients with ICM. R2I2 was significantly higher in the Study patients than in Controls (mean ± standard error of the mean: 1.09±0.06 versus 0.63±0.04, P<0.001). Over a median follow-up period of 23 months, 6 of 26 Study group patients had VA or death. R2I2 predicted VA or death independently of demographic factors, electrophysiology study result, left ventricular ejection fraction, or QRS duration (Cox model, P=0.029). R2I2 correlated with peri-infarct zone as assessed by cardiac magnetic resonance imaging (r=0.51, P=0.024). The findings were replicated in the Replication group: R2I2 was significantly higher in 11 of 40 Replication patients experiencing VA (1.18±0.10 versus 0.92±0.05, P=0.019). In combined analysis of ICM cohorts, R2I2 ≥1.03 identified subjects with significantly higher risk of VA or death (43%) compared with R2I2 <1.03 (11%) (P=0.004).
Conclusions: In this pilot study, we have developed a novel VA risk marker, R2I2, and have shown that it correlated with a structural measure of arrhythmic risk and predicted risk of VA or death in patients with ICM. R2I2 may improve risk stratification and merits further evaluation. (J Am Heart Assoc. 2012;1:e001552 doi: 10.1161/JAHA.112.001552.).
Keywords: electrical restitution; electrocardiography; implantable cardioverter defibrillator; risk factors; sudden, death.
Figures
Similar articles
-
Prospective evaluation of two novel ECG-based restitution biomarkers for prediction of sudden cardiac death risk in ischaemic cardiomyopathy.Heart. 2014 Dec;100(23):1878-85. doi: 10.1136/heartjnl-2014-305672. Epub 2014 Aug 4. Heart. 2014. PMID: 25092878
-
Application of two novel electrical restitution-based ECG markers of ventricular arrhythmia to patients with nonischemic cardiomyopathy.Pacing Clin Electrophysiol. 2021 Feb;44(2):284-292. doi: 10.1111/pace.14143. Epub 2021 Jan 4. Pacing Clin Electrophysiol. 2021. PMID: 33336815
-
Investigation of the relationship between two novel electrocardiogram-based sudden cardiac death risk markers and autonomic function.J Electrocardiol. 2018 Sep-Oct;51(5):889-894. doi: 10.1016/j.jelectrocard.2018.07.013. Epub 2018 Jul 19. J Electrocardiol. 2018. PMID: 30177335
-
Myocardial Fibrosis Assessment by LGE Is a Powerful Predictor of Ventricular Tachyarrhythmias in Ischemic and Nonischemic LV Dysfunction: A Meta-Analysis.JACC Cardiovasc Imaging. 2016 Sep;9(9):1046-1055. doi: 10.1016/j.jcmg.2016.01.033. Epub 2016 Jul 20. JACC Cardiovasc Imaging. 2016. PMID: 27450871 Review.
-
Impact of chronic total occlusion on ventricular arrhythmia and mortality in ischaemic cardiomyopathy patient with implantable cardiac defibrillator: a meta-analysis.Acta Cardiol. 2019 Oct;74(5):395-402. doi: 10.1080/00015385.2018.1516268. Epub 2018 Oct 17. Acta Cardiol. 2019. PMID: 30328769 Review.
Cited by
-
ECG Restitution Analysis and Machine Learning to Detect Paroxysmal Atrial Fibrillation: Insight from the Equine Athlete as a Model for Human Athletes.Function (Oxf). 2020 Nov 18;2(1):zqaa031. doi: 10.1093/function/zqaa031. eCollection 2021. Function (Oxf). 2020. PMID: 35330977 Free PMC article.
-
Predictive Value of T peak - T end Indices for Adverse Outcomes in Acquired QT Prolongation: A Meta-Analysis.Front Physiol. 2018 Sep 3;9:1226. doi: 10.3389/fphys.2018.01226. eCollection 2018. Front Physiol. 2018. PMID: 30233403 Free PMC article.
-
Repolarization indicates electrical instability in ventricular arrhythmia originating from papillary muscle.Europace. 2023 Feb 16;25(2):688-697. doi: 10.1093/europace/euac126. Europace. 2023. PMID: 35989424 Free PMC article.
-
Restitution metrics in Brugada syndrome: a systematic review and meta-analysis.J Interv Card Electrophysiol. 2020 Mar;57(2):319-327. doi: 10.1007/s10840-019-00675-z. Epub 2019 Dec 14. J Interv Card Electrophysiol. 2020. PMID: 31836966
-
The mechanical uncoupler blebbistatin is associated with significant electrophysiological effects in the isolated rabbit heart.Exp Physiol. 2013 May;98(5):1009-27. doi: 10.1113/expphysiol.2012.069369. Epub 2013 Jan 4. Exp Physiol. 2013. PMID: 23291912 Free PMC article.
References
-
- Myerburg RJ, Mitrani RM, Kessler KM, Castellanos A. Frequency of sudden cardiac death and profiles of risk. Am J Cardiol. 1997;80:10F-19F - PubMed
-
- Kusmirek SL, Gold MR. Sudden cardiac death: the role of risk stratification. Am Heart J. 2007;153:25-33 - PubMed
-
- Sanders GD, Al-Khatib SM, Berliner E, Bigger JT, Buxton AE, Califf RM, Carlson M, Curtis AB, Curtis JP, Domanski M, Fain E, Gersh BJ, Gold MR, Goldberger J, Haghighi-Mood A, Hammill SC, Harder J, Healey J, Hlatky MA, Hohnloser SH, Lee KL, Mark DB, Mitchell B, Phurrough S, Prystowsky E, Smith JM, Stockbridge N, Temple R. Preventing tomorrow's sudden cardiac death today, part II: Translating sudden cardiac death risk assessment strategies into practice and policy. Am Heart J. 2007;153:951-959 - PubMed
-
- Han J, Moe GK. Nonuniform recovery of excitability in ventricular muscle. Circ Res. 1964;14:44-60 - PubMed
-
- Kuo CS, Munakata K, Reddy CP, Surawicz B. Characteristics and possible mechanism of ventricular arrhythmia dependent on the dispersion of action potential durations. Circulation. 1983;67:1356-1367 - PubMed
LinkOut - more resources
Full Text Sources
Other Literature Sources
Medical
