

Measurement of reverse cholesterol transport pathways in humans: in vivo rates of free cholesterol efflux, esterification, and excretion
- PMID: 23130164
- PMCID: PMC3487360
- DOI: 10.1161/JAHA.112.001826
Measurement of reverse cholesterol transport pathways in humans: in vivo rates of free cholesterol efflux, esterification, and excretion
Abstract
Background: Reverse cholesterol transport from peripheral tissues is considered the principal atheroprotective mechanism of high-density lipoprotein, but quantifying reverse cholesterol transport in humans in vivo remains a challenge. We describe here a method for measuring flux of cholesterol though 3 primary components of the reverse cholesterol transport pathway in vivo in humans: tissue free cholesterol (FC) efflux, esterification of FC in plasma, and fecal sterol excretion of plasma-derived FC.
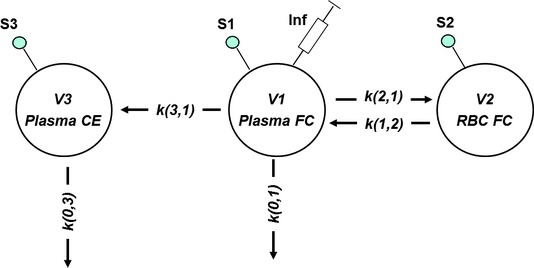
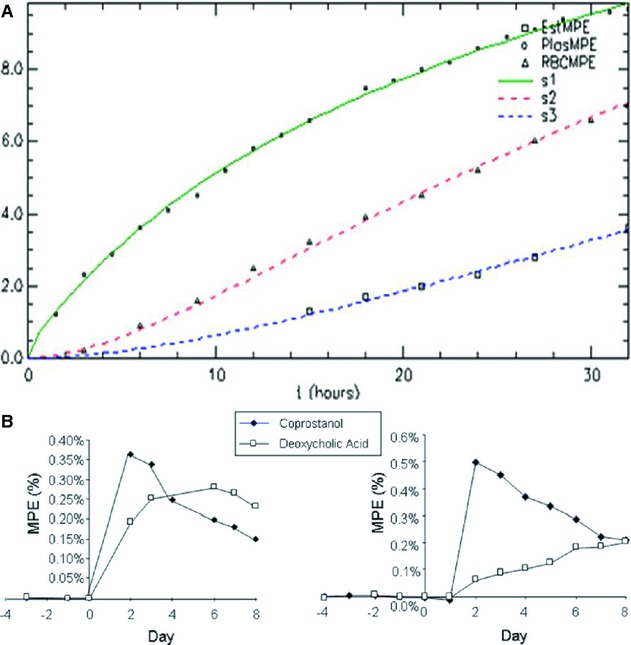
Methods and results: A constant infusion of [2,3-(13)C(2)]-cholesterol was administered to healthy volunteers. Three-compartment SAAM II (Simulation, Analysis, and Modeling software; SAAM Institute, University of Washington, WA) fits were applied to plasma FC, red blood cell FC, and plasma cholesterol ester (13)C-enrichment profiles. Fecal sterol excretion of plasma-derived FC was quantified from fractional recovery of intravenous [2,3-(13)C(2)]-cholesterol in feces over 7 days. We examined the key assumptions of the method and evaluated the optimal clinical protocol and approach to data analysis and modeling. A total of 17 subjects from 2 study sites (n=12 from first site, age 21 to 75 years, 2 women; n=5 from second site, age 18 to 70 years, 2 women) were studied. Tissue FC efflux was 3.79±0.88 mg/kg per hour (mean ± standard deviation), or ≍8 g/d. Red blood cell-derived flux into plasma FC was 3.38±1.10 mg/kg per hour. Esterification of plasma FC was ≍28% of tissue FC efflux (1.10±0.38 mg/kg per hour). Recoveries were 7% and 12% of administered [2,3-(13)C(2)]-cholesterol in fecal bile acids and neutral sterols, respectively.
Conclusions: Three components of systemic reverse cholesterol transport can be quantified, allowing dissection of this important function of high-density lipoprotein in vivo. Effects of lipoproteins, genetic mutations, lifestyle changes, and drugs on these components can be assessed in humans. (J Am Heart Assoc. 2012;1:e001826 doi: 10.1161/JAHA.112.001826.).
Keywords: cholesterol efflux; esterification; isotope labeling, stable; reverse cholesterol transport; sterol excretion.
Figures
Similar articles
-
Inhibition of intestinal cholesterol absorption with ezetimibe increases components of reverse cholesterol transport in humans.Atherosclerosis. 2013 Oct;230(2):322-9. doi: 10.1016/j.atherosclerosis.2013.08.006. Epub 2013 Aug 13. Atherosclerosis. 2013. PMID: 24075764 Clinical Trial.
-
In vivo tissue cholesterol efflux is reduced in carriers of a mutation in APOA1.J Lipid Res. 2013 Jul;54(7):1964-71. doi: 10.1194/jlr.P028449. Epub 2013 May 6. J Lipid Res. 2013. PMID: 23650622 Free PMC article.
-
Revisiting Reverse Cholesterol Transport in the Context of High-Density Lipoprotein Free Cholesterol Bioavailability.Methodist Debakey Cardiovasc J. 2019 Jan-Mar;15(1):47-54. doi: 10.14797/mdcj-15-1-47. Methodist Debakey Cardiovasc J. 2019. PMID: 31049149 Free PMC article. Review.
-
ABCA1-Derived Nascent High-Density Lipoprotein-Apolipoprotein AI and Lipids Metabolically Segregate.Arterioscler Thromb Vasc Biol. 2017 Dec;37(12):2260-2270. doi: 10.1161/ATVBAHA.117.310290. Epub 2017 Oct 26. Arterioscler Thromb Vasc Biol. 2017. PMID: 29074589 Free PMC article.
-
Rethinking reverse cholesterol transport and dysfunctional high-density lipoproteins.J Clin Lipidol. 2018 Jul-Aug;12(4):849-856. doi: 10.1016/j.jacl.2018.04.001. Epub 2018 Apr 12. J Clin Lipidol. 2018. PMID: 29731282 Free PMC article. Review.
Cited by
-
HDL flux is higher in patients with nonalcoholic fatty liver disease.Am J Physiol Endocrinol Metab. 2019 Nov 1;317(5):E852-E862. doi: 10.1152/ajpendo.00193.2019. Epub 2019 Sep 10. Am J Physiol Endocrinol Metab. 2019. PMID: 31503515 Free PMC article.
-
Phospholipid Component Defines Pharmacokinetic and Pharmacodynamic Properties of Synthetic High-Density Lipoproteins.J Pharmacol Exp Ther. 2020 Feb;372(2):193-204. doi: 10.1124/jpet.119.257568. Epub 2019 Nov 27. J Pharmacol Exp Ther. 2020. PMID: 31776208 Free PMC article.
-
Alginic acid cell entrapment: a novel method for measuring in vivo macrophage cholesterol homeostasis.J Lipid Res. 2015 Feb;56(2):470-83. doi: 10.1194/jlr.D052985. Epub 2014 Dec 1. J Lipid Res. 2015. PMID: 25465389 Free PMC article.
-
Oxidative modification of HDL by lipid aldehydes impacts HDL function.Arch Biochem Biophys. 2022 Nov 15;730:109397. doi: 10.1016/j.abb.2022.109397. Epub 2022 Sep 15. Arch Biochem Biophys. 2022. PMID: 36116503 Free PMC article. Review.
-
Cholesterol metabolism in cholestatic liver disease and liver transplantation: From molecular mechanisms to clinical implications.World J Hepatol. 2016 Aug 8;8(22):924-32. doi: 10.4254/wjh.v8.i22.924. World J Hepatol. 2016. PMID: 27574546 Free PMC article. Review.
References
-
- Goldstein JL, Brown MS. Regulation of the mevalonate pathway. Nature. 1990;343:425-430 - PubMed
-
- Dietschy JM, Turley SD, Spady DK. Role of liver in the maintenance of cholesterol and low density lipoprotein homeostasis in different animal species, including humans. J Lipid Res. 1993;34:1637-1659 - PubMed
-
- Phillips MC, Johnson WJ, Rothblat GH. Mechanisms and consequences of cellular cholesterol exchange and transfer. Biochim Biophys Acta. 1987;906:223-276 - PubMed
-
- Fielding CJ, Fielding PE. Cellular cholesterol efflux. Biochim Biophys Acta. 2001;1533:175-189 - PubMed
Grants and funding
LinkOut - more resources
Full Text Sources
Other Literature Sources
