. 2012 Dec 15;28(24):3265-73.
doi: 10.1093/bioinformatics/bts616. Epub 2012 Nov 6.

FOLD-EM: automated fold recognition in medium- and low-resolution (4-15 Å) electron density maps

Affiliations

FOLD-EM: automated fold recognition in medium- and low-resolution (4-15 Å) electron density maps

Mitul Saha et al. Bioinformatics. .

Abstract

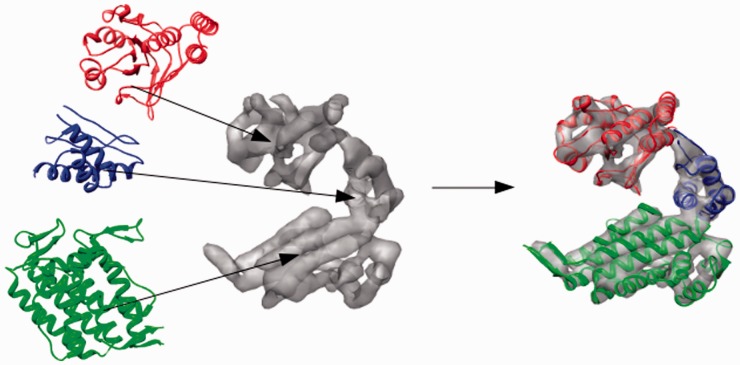
Motivation: Owing to the size and complexity of large multi-component biological assemblies, the most tractable approach to determining their atomic structure is often to fit high-resolution radiographic or nuclear magnetic resonance structures of isolated components into lower resolution electron density maps of the larger assembly obtained using cryo-electron microscopy (cryo-EM). This hybrid approach to structure determination requires that an atomic resolution structure of each component, or a suitable homolog, is available. If neither is available, then the amount of structural information regarding that component is limited by the resolution of the cryo-EM map. However, even if a suitable homolog cannot be identified using sequence analysis, a search for structural homologs should still be performed because structural homology often persists throughout evolution even when sequence homology is undetectable, As macromolecules can often be described as a collection of independently folded domains, one way of searching for structural homologs would be to systematically fit representative domain structures from a protein domain database into the medium/low resolution cryo-EM map and return the best fits. Taken together, the best fitting non-overlapping structures would constitute a 'mosaic' backbone model of the assembly that could aid map interpretation and illuminate biological function.

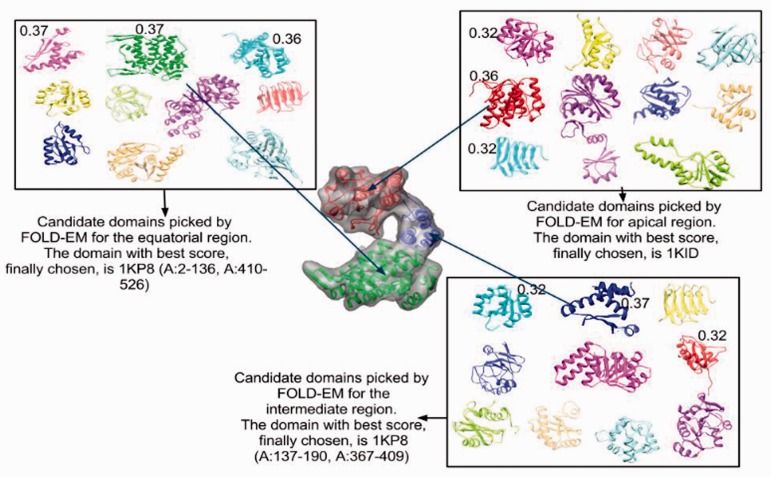
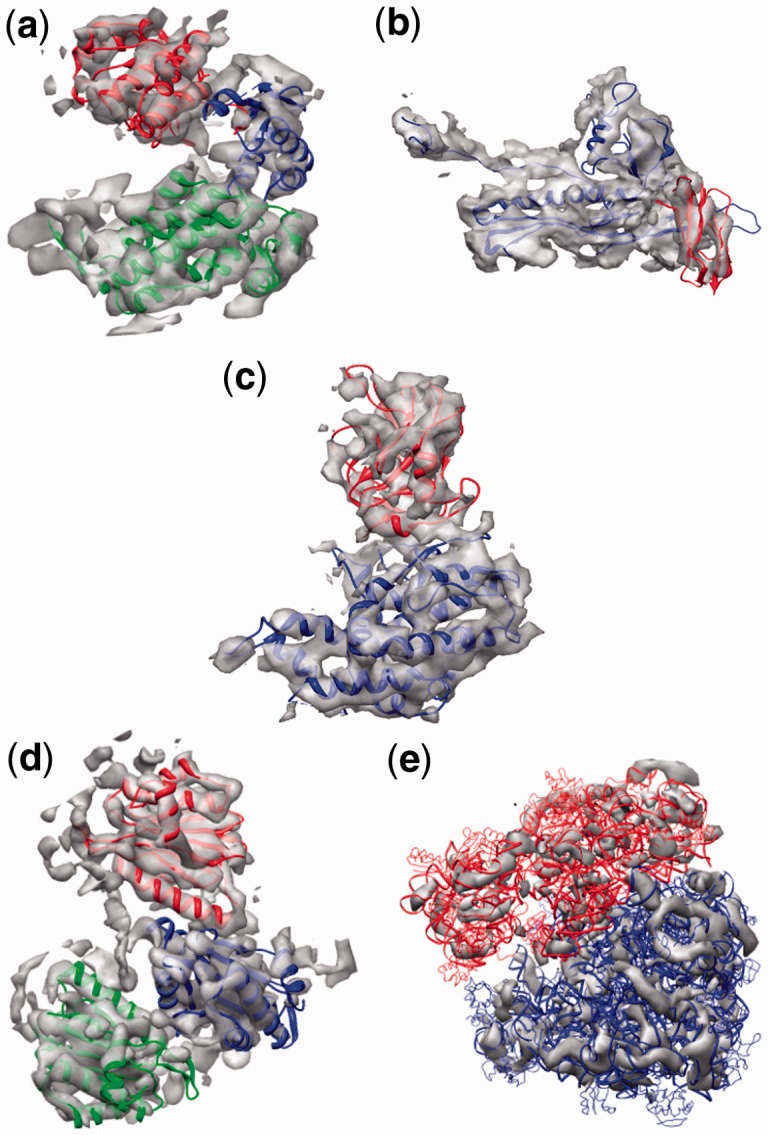
Result: Using the computational principles of the Scale-Invariant Feature Transform (SIFT), we have developed FOLD-EM-a computational tool that can identify folded macromolecular domains in medium to low resolution (4-15 Å) electron density maps and return a model of the constituent polypeptides in a fully automated fashion. As a by-product, FOLD-EM can also do flexible multi-domain fitting that may provide insight into conformational changes that occur in macromolecular assemblies.


Figures

Fig. 1.
Fig. 1.
We test the ability of FOLD-EM, to fit different sized domains (the equatorial, apical and intermediate domains of GroEL; ribbon models shown on left) into cryo-EM maps simulated from the GroEL monomer (PDB ID: 1OEL, density maps shown in gray), in the resolution range of 5–20 Å. The rightmost panel shows the result of fitting the three domains using FOLD-EM
Fig. 2.
Fig. 2.
(a) Fit of the atomic resolution GroEL domains (red, blue and green ribbon models) into a 6 Å cryo-EM map (grey) of GroEL (from Ludtke et al., 2004) using FOLD-EM. The fittings are consistent (Supplementary Table S5 gives fitting RMSD errors) with previously published results in Ludtke et al. (2004). (b) Fit of the atomic-resolution GroEL intermediate domain (blue ribbon model) into the 6 Å GroEL cryo-EM map, as determined by FOLD-EM [as in (b) above] enlarged, with only the map region of the intermediate domain shown for clarity). (c) Incorrect fits of the same intermediate domain (ribbon models) into regions other than the intermediate domain region (circled), of the map obtained using popular fitting software—SITUS (magenta), FOLDHUNTER (cyan), the Chimera fitting tool (yellow), MODELLER (red), MOLREP (blue) and COAN (green); the apical and equatorial domains of GroEL were successfully fit by other popular software. We suspect that other programs were not able to fit the intermediate domain because it is very small compared with the target map
Fig. 3.
Fig. 3.
(a) Successful fit of the HK97 (blue ribbon) and BIG2 domains (red ribbon) into cryo-EM density of the phi29 isometric particle obtained using FOLD-EM (Morais et al., 2005; Supplementary Table S5). (b) Incorrect fit of the BIG2 domain, into regions other than the BIG2 domain region (circled), obtained using the popular fitting software described above—SITUS (magenta), FOLDHUNTER (cyan), Chimera fitting tool (yellow), MODELLER (red), MOLREP (blue) and COAN (green). Again, we suspect that these failures occurred because the BIG2 domain is too small compared with the target map
Fig. 4.
Fig. 4.
(a and b) Cartoon illustrating problems associated with fitting partial structures. The high-resolution structure (wire model in red and black) has extraneous region (red), which does not have corresponding density in the target map (pale blue region). This extraneous region can act as noise and reduce the accuracy of the fit and the associated score [as seen in (b)]. As FOLD-EM can separate conserved regions from non-conserved ones, it will ignore the red extraneous region, yielding an accurate fit (a) and associated score
Fig. 5.
Fig. 5.
(a–c) show examples of independently folded domains with extrananeous non-homologous features that were successfully fitted using FOLD-EM. The red regions show the noise/extraneous residues that were incorporated to test the robustness of FOLD-EM. (d) The fitted green ribbon structure shows the correct fit (consistent with Ludtke et al., 2004); Supplementary Table S5 gives the fitting RMSD error) of the apical domain with ∼20 added extraneous residues (shown on right), obtained using FOLD-EM. The rest of the ribbon structures show the incorrect fittings obtained using the popular fitting software—SITUS (magenta), FOLDHUNTER (cyan), Chimera fitting tool (yellow) and MODELLER (red). As seen, the incorrect fits occur outside the upper apical domain region, except in the case of FOLDHUNTER, where the fit is still off by at least 25 Å RMSD. (e) The fitted green ribbon structure shows the correct fit (consistent with Ludtke et al., 2004); Supplementary Table S5 gives fitting RMSD error) of the equatorial domain with ∼150 added extraneous residues added (shown on right), obtained using FOLD-EM. The rest of the ribbon structures show the incorrect fits obtained using the popular fitting software—SITUS (magenta), FOLDHUNTER (cyan), Chimera fitting tool (yellow) and MODELLER (red). As seen, the incorrect fits occur outside the bottom equatorial domain region, except in the case SITUS, where the fit is still off by at least 6.2 Å RMSD
Fig. 6.
Fig. 6.
(a and b) Cryo-EM density of capsid monomers from pre- and post-capsid maturation states of phage P22, respectively (10). (c and d) The conserved region between the monomers [shown in (a and b)] is shown in blue, as determined by FOLD-EM. The rest of the region is shown as red. (e and f) Here, only the conserved region [colored as blue in (c and d), respectively] is shown, from two different views. (g and h) [enlarged with respect to (a and b)]: alignment of the extracted conserved pairs [shown in view #2 of (e and f)] using FOLD-EM and data from Jiang et al. (2003), respectively. Circled regions in (h) highlight areas of poor local alignment, determined by visual inspection
Fig. 7.
Fig. 7.
(a–c, left) We created three fictitious atomic-resolution structures based on GroEL, one with two domains (a, left), one with three domains (b, left) and one with four domains (c, left). Next, we attempted to fit each synthetic structure into a low-resolution density map of the structure in a different conformation. For example, the three-domain structure (b, left) is docked into a map (simulated from the three-domain GroEL structure PDB ID: 1OEL) in a different conformation shown in (b, right). Embedded ribbon structures shown in the figures are the ones used to simulate the respective maps. (d–f) Fitting of conformation #2 [d or (b, left)] using FOLD-EM results in reorganization of the domains into a new structure (e) that fits the simulated GroEL 10 Å cryo-EM map well
Fig. 8.
Fig. 8.
(a–d) Fitting of an atomic-resolution GroEL conformation (a, PDB ID: 1AON), using FOLD-EM, into a lower resolution (4 Å) GroEL map (b, Ludtke et al., 2008) in a different conformation. This needed spatial reorganization of the domains in the atomic structure, resulting in a new structure (c) which fits the target map well, as seen in (d). (e–h) The same application and outcome as (a–d), except that here the target map is the (6 Å) GroEL map from Ludtke et al. (2004)
Fig. 9.
Fig. 9.
The construction of a Cα backbone model for a simulated GroEL map from the best-scored candidate domains (first row in Supplementary Table S4a)
Fig. 10.
Fig. 10.
(a) The fit of GroEL domains as determined by FOLD-EM is consistent with Ludtke et al. (2004); Supplementary Table S5 gives the RMSD errors associated with fitting the three chosen domains into the 6 Å cryo-EM map of GroEL. (b) The fit of HK97 and BIG2 domains as determined by FOLD-EM is consistent with Morais et al. (2005); Supplementary Table S5 gives the RMSD errors associated with fitting the two chosen domains into the 7.9 Å cryo-EM map of ф29 (Morais et al., 2005). (c) The fit of independent domains of the Rice Dwarf Virus capisd protein as determined by FOLD-EM is consistent with Zhou et al. (2001), and Nakagawa et al. (2003); Supplementary Table S5 gives RMSD errors associated with fitting each of the two chosen domains into the 6.8 Å cryo-EM map of Rice Dwarf Virus (Zhou et al., 2001). (d) The fit of three domains from the 20S proteasome as determined by FOLD-EM is consistent with Rabl et al. (2008); Supplementary Table S5 gives the RMSD errors associated with fitting the chosen trimer domain into the 6.8 Å cryo-EM map of 20 S proteasome (Rabl et al., 2008). (e) The fit of 30S and 50S domains from the 70S ribosome into the 12.5 Å cryo-EM map of the 70S ribosome (Valle et al., 2003); Supplementary Table S5 gives the errors associated with fitting the chosen domains into the 12.5 Å map of the 70S ribosome

Similar articles

Cited by

References

    1. Gorba C., et al. Normal-mode flexible fitting of high-resolution structure of biological molecules toward one-dimensional low-resolution data. Biophys. J. 2008;94:1589–1599. - PMC - PubMed
    1. Jiang W., et al. Bridging the information gap: computational tools for intermediate resolution structure interpretation. J. Mol. Biol. 2001;208:1033–1044. - PubMed
    1. Jiang W., et al. Coat protein fold and maturation transition of bacteriophage P22 seen at subnanometer resolutions. Nat. Struct. Biol. 2003;10:131–135. - PubMed
    1. Khayat R., et al. An automated procedure for detecting protein folds from sub-nanometer resolution electron density. J. Struct. Biol. 2010;170:513–521. - PMC - PubMed
    1. Lasker K., et al. Discovery of protein substructures in EM maps. Algorithms in Bioinformatics. 2005;3692:423–434.

Publication types