. 2013:955:427-60.
doi: 10.1007/978-1-62703-176-9_23.

Electron tomography of paracrystalline 2D arrays

Affiliations

Electron tomography of paracrystalline 2D arrays

Hanspeter Winkler et al. Methods Mol Biol. 2013.

Abstract

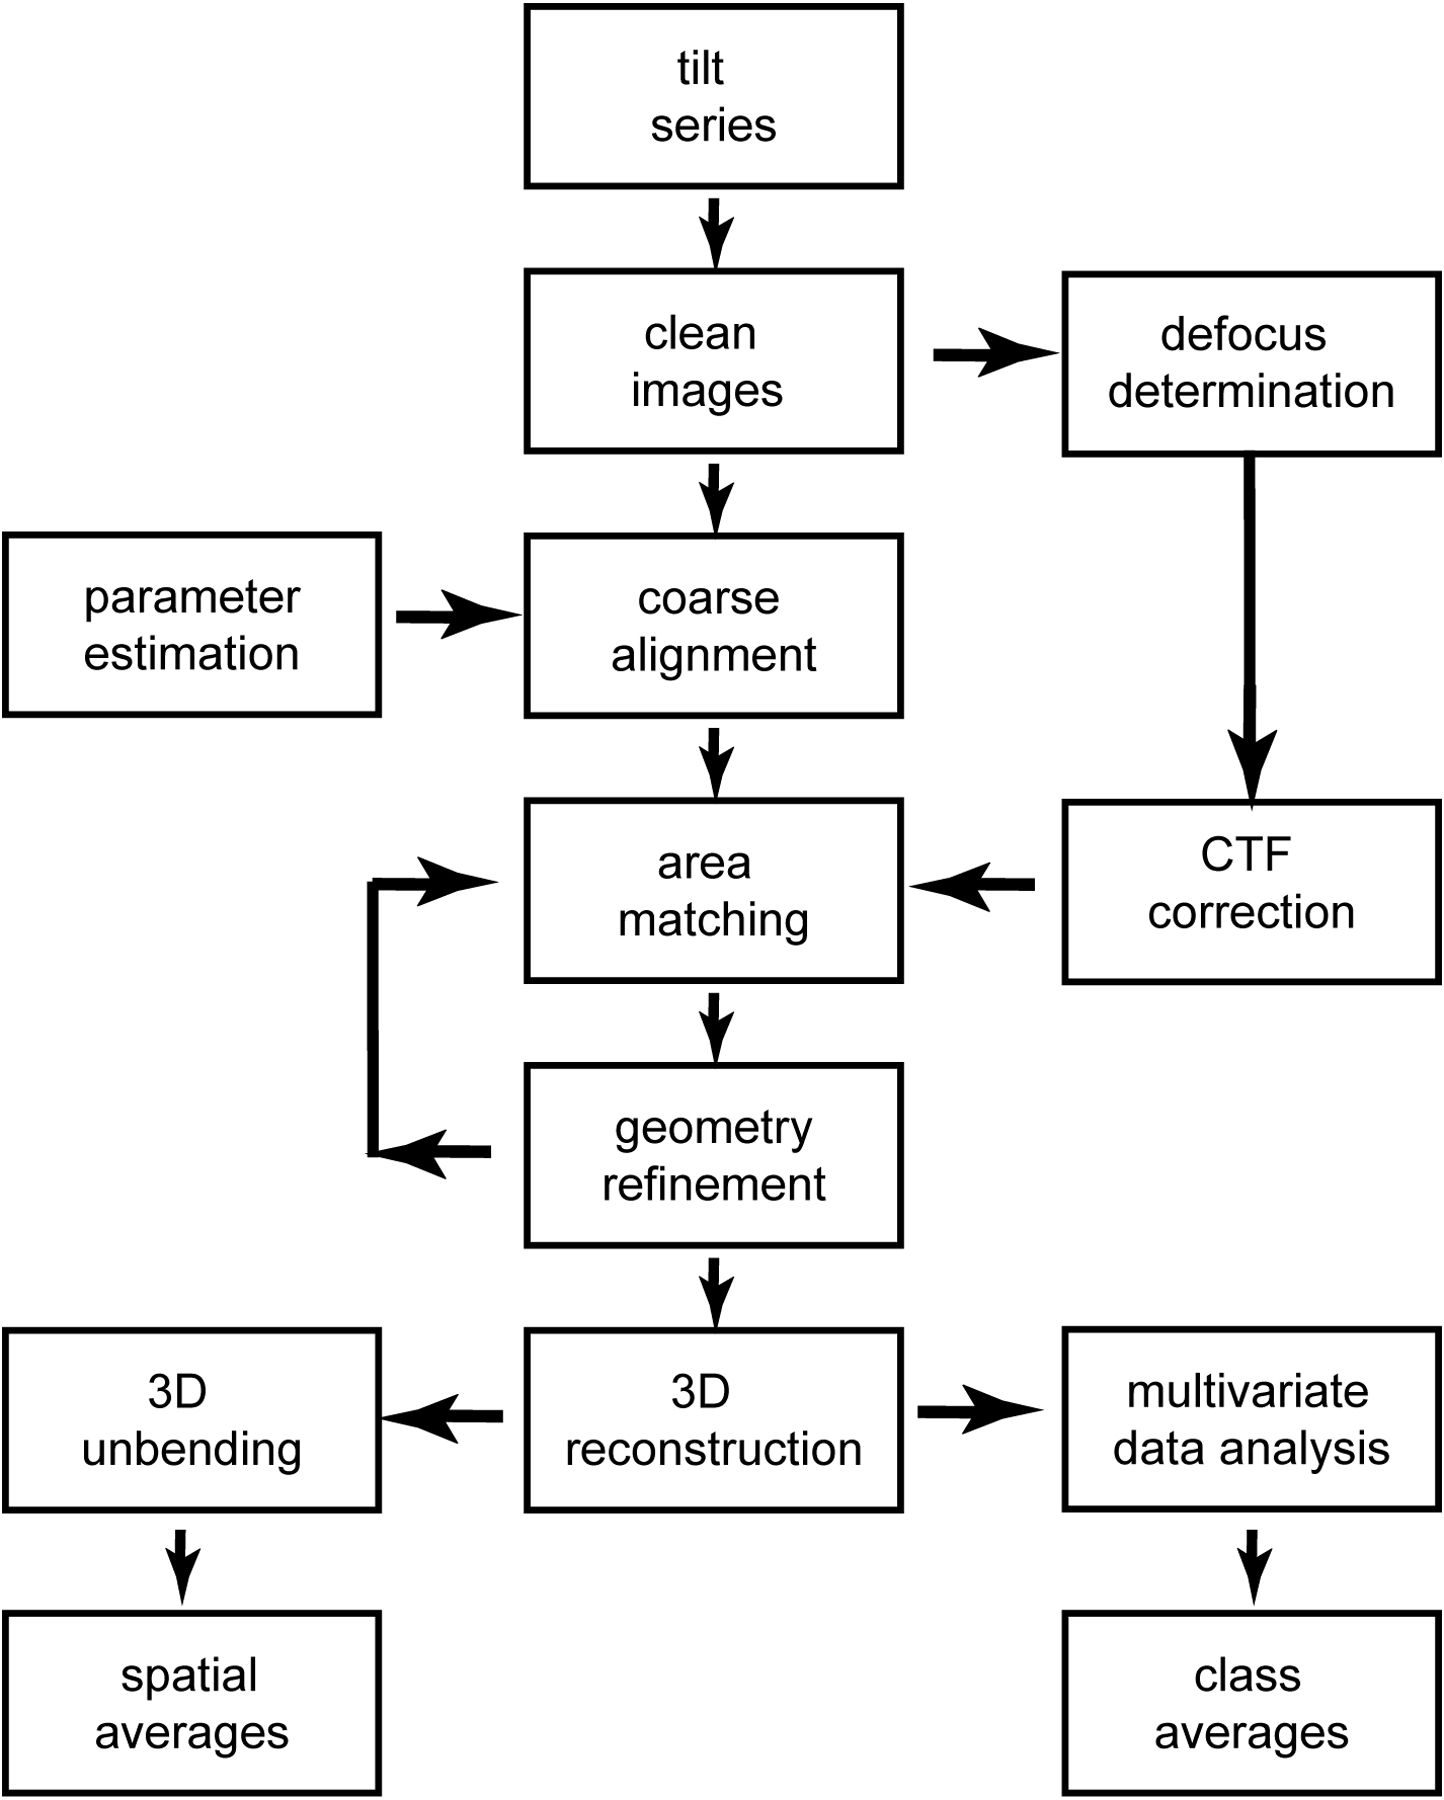
Paracrystalline arrays possess specific types of disorder that reduce the structural information as well as resolution when spatially averaged over repeating motifs. Electron tomography combined with motif classification and averaging can solve the heterogeneity problem and provide information on the structural elements that give rise to the disorder. This chapter describes procedures that would be used in a typical tomography application to identify and characterize a paracrystalline specimen. Particular emphasis is given to actively contracting insect flight muscle, a specimen with particularly difficult to characterize structural heterogeneity and 2D paracrystalline arrays of myosin-V, from which a particularly high resolution motif average was obtained. All aspects of the study are described including data collection, merging of micrographs to produce the tomogram, alignment to an invariant structural element, classification and averaging of heterogeneous structures, and reassembly of focused class averages into high signal-to-noise ratio representations of the original raw repeats. Particular emphasis is placed on limitations of the various processes to produce the final class averages.


Figures

Figure 1.
Figure 1.
Tomography flowchart. From reference (13).
Figure 2.
Figure 2.
Singular values of the correction matrix after the first iteration (red ) and after the last iteration (green ) for an ice-embedded specimen. Once an accurate estimate of the tilt azimuth has been obtained the singular values usually deviate less than 1% from a value of 1.
Figure 3.
Figure 3.
Tilt geometry. (x,y,z): coordinate system fixed with respect to the microscope. z is the optical axis, A (the x-y-plane) is the image plane. (x’,y’,z’): coordinate system fixed with respect to the specimen. The transformation from (x,y,z) to (x’,y’,z’) consists of a tilt about the axis t and angle θ and an additional rotation (ψ’,θ’,φ’) which defines the orientation of the specimen (C) with respect to the specimen holder (B). From reference (13).
Figure 4.
Figure 4.
Manual picking using i3display. The image shown is a projection from a tomogram of 2D paracrystalline arrays of myosin-V (1). The centers of so-called “flower motifs” are marked in yellow. Had the image been the actual tomogram, the z-coordinate of these points would be color coded: yellow for points at the same z-level as the currently displayed section, blue for points below and green for points above that level.
Figure 5.
Figure 5.
Dendrogram showing the relationship between class averages of myosin-V petal motifs. See Figure 8B legend for explanation of the structural elements. The class number is given in the upper right hand corner. Class 3 is the most isolated class because the myosin heads are more closely apposed than for the other 4 classes, all of which are related at one level. Bar equals 10 nm.
Figure 6.
Figure 6.
MDA masks. Masks are shown as translucent, colored surfaces superimposed on the global average as a solid gray surface to provide a spatial reference point. (A) Surface display of left (light purple) and right (magenta) primary masks for primary cross-bridge classifications. The actin target zone, where most of the myosin heads bind, is positioned in the middle of the mask. View perspectives from left to right: top view (looking toward Z-line), front view (with the Z-line positioned toward the bottom), and tilted view. (B, C) Surface display of masks specific for troponin bridges. (B) Mask for back-left (yellow) and front-right (cyan) masks. (C) Mask for front-left (green) and back-right (orange) masks. (D) Surface display of masks specific for the myosin lever arms positioned near the thick filament surface. (E) Special mask to identify out-of-target-zone cross-bridges in four separate regions of the repeat. From reference (40).
Figure 7.
Figure 7.
Repeat reassembly. Different masked regions of each raw repeat are subjected to separate MDA and classification using left and right-side primary masks and four Tn region masks. Each classified region is represented by a corresponding class average. The original repeat is represented by a reassembled repeat from all these class averages. From left to right: column A: a raw repeat; column B: six different MDA masks, which are the same as depicted in Figure 5, are applied to this repeat for separate MDA and classification with the mask superimposed; column C: class averages computed for each of the different masked regions of the raw repeat; column D: partially reassembled repeat, the top image combines the class averages from primary left- and right-side classifications and the bottom one combines the class averages from different Tn bridge mask classifications; column E: the whole repeat is reassembled by combining the highlighted portions in column D. Modified from reference (40).
Figure 8.
Figure 8.
Myosin-V paracrystalline arrays. (A) Power spectrum of a myosin-V array showing the resolution limitation. White lines define the reciprocallattice. Spots extend to about the 5th order or a resolution of ~90 Å. (B) Molecular arrangement within the “cone-flower” motif. At the top is an opaque surface rendering viewed from the solvent phase onto the lipid monolayer; bottom is a translucent surface view with the myosin-V atomic model rendered in space filling. Color scheme for the bottom molecule: motor domains - red and magenta, light chains – green, heavy chain component of the lever arm - blue, coiled-coil domain - cyan, cargo-binding domain density envelope - yellow, adjacent molecules - gray. Note that the cargo binding domains have swapped binding partners and in the cone-flower motif bind the motor domains of adjacent myosin-V molecules. Panel B from reference (1).
Figure 9.
Figure 9.
Classification of myosin V petal motifs. See Figure 8B legend for explanation of the structural elements. Bar equals 10 nm. (A) Here the classification was carried out using aligned motifs to produce five classes (0–4, black numbers in the lower right hand corner). The number of motifs (white lettering) contributing to the class averages is given at the bottom left. The bottom row shows histograms of the tilt axis directions with respect to the petal motif with each bin representing the fraction of the total number of motifs that fall within a particular angle range. Note the complementarity of the angular distribution for classes 1 and 2. The complementarity is reflected in the density of the lever arms and the density attributable to the cargo binding domain. (B) Here the classification was carried out with projections of the motifs instead of the motifs themselves. Note that when using the projections the angular bias found for the volumes disappears. Modified from reference (15).

Similar articles

Cited by

References

    1. Liu J, Taylor DW, Krementsova EB, Trybus KM, and Taylor KA (2006) Three-dimensional structure of the myosin V inhibited state by cryoelectron tomography. Nature 442, 208–211. - PubMed
    1. Taylor KA, Tang J, Cheng Y, and Winkler H (1997) The use of electron tomography for structural analysis of disordered protein arrays. J. Struct. Biol 120, 372–386. - PubMed
    1. Wu S, Liu J, Reedy MC, Tregear RT, Winkler H, Franzini-Armstrong C, et al. (2010) Electron tomography of cryofixed, isometrically contracting insect flight muscle reveals novel actin-myosin interactions. PLoS-ONE 5, e12643. - PMC - PubMed
    1. Hampton CM, Liu J, Taylor DW, DeRosier DJ, and Taylor KA (2008) The 3D structure of villin as an unusual F-Actin crosslinker. Structure 16, 1882–1891. - PMC - PubMed
    1. Zhu P, Liu J, Bess J Jr., Chertova E, Lifson JD, Grise H, et al. (2006) Distribution and three-dimensional structure of AIDS virus envelope spikes. Nature 441, 847–852. - PubMed

Publication types

MeSH terms

LinkOut - more resources