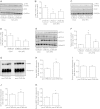
Delivery of adiponectin gene to skeletal muscle using ultrasound targeted microbubbles improves insulin sensitivity and whole body glucose homeostasis
- PMID: 23132298
- PMCID: PMC3543570
- DOI: 10.1152/ajpendo.00493.2012
Delivery of adiponectin gene to skeletal muscle using ultrasound targeted microbubbles improves insulin sensitivity and whole body glucose homeostasis
Abstract
Numerous studies have shown that adiponectin confers antidiabetic effects via both insulin-like and insulin-sensitizing actions. The majority of adiponectin in circulation is derived from adipocytes; however, other tissues such as skeletal muscle can produce adiponectin. This study was designed to investigate the functional significance of adiponectin produced by skeletal muscle. We encapsulated the adiponectin gene in lipid-coated microspheres filled with octafluoropropane gas that were injected into the systemic circulation and destroyed within the microvasculature of skeletal muscle using ultrasound. We first demonstrated safe and successful targeting of luciferase and green fluorescent protein reporter genes to skeletal muscle using this approach and then confirmed efficient overexpression of adiponectin mRNA and oligomeric protein forms. Glucose tolerance test indicated that overexpression of adiponectin in skeletal muscle was able to improve glucose intolerance induced by feeding mice a high-fat diet (HFD), and this correlated with improved skeletal muscle insulin signaling. We then performed hyperinsulinemic-euglycemic clamp studies and demonstrated that adiponectin overexpression attenuated the decreases in glucose infusion rate, glucose disposal, and increase in glucose appearance induced by HFD. Ultrasound-targeted microbubble destruction (UTMD) delivery of adiponectin to skeletal muscle also enhanced serum adiponectin levels and improved hepatic insulin sensitivity. In conclusion, our data show that UTMD efficiently delivers adiponectin to skeletal muscle and that this improves insulin sensitivity and glucose homeostasis.
Figures


Similar articles
-
Adiponectin stimulates autophagy and reduces oxidative stress to enhance insulin sensitivity during high-fat diet feeding in mice.Diabetes. 2015 Jan;64(1):36-48. doi: 10.2337/db14-0267. Epub 2014 Jul 28. Diabetes. 2015. PMID: 25071026
-
Adiponectin corrects high-fat diet-induced disturbances in muscle metabolomic profile and whole-body glucose homeostasis.Diabetes. 2013 Mar;62(3):743-52. doi: 10.2337/db12-0687. Epub 2012 Dec 13. Diabetes. 2013. PMID: 23238294 Free PMC article.
-
Engineering brown fat into skeletal muscle using ultrasound-targeted microbubble destruction gene delivery in obese Zucker rats: Proof of concept design.IUBMB Life. 2017 Sep;69(9):745-755. doi: 10.1002/iub.1658. Epub 2017 Jul 31. IUBMB Life. 2017. PMID: 28762248
-
Metabolism and insulin signaling in common metabolic disorders and inherited insulin resistance.Dan Med J. 2014 Jul;61(7):B4890. Dan Med J. 2014. PMID: 25123125 Review.
-
[Adiponectin: from adipocyte to skeletal muscle].Ann Endocrinol (Paris). 2004 Feb;65(1 Suppl):S36-43. doi: 10.1016/s0003-4266(04)95999-9. Ann Endocrinol (Paris). 2004. PMID: 15163922 Review. French.
Cited by
-
Adiponectin is not required for exercise training-induced improvements in glucose and insulin tolerance in mice.Physiol Rep. 2014 Sep 11;2(9):e12146. doi: 10.14814/phy2.12146. Print 2014 Sep 1. Physiol Rep. 2014. PMID: 25214523 Free PMC article.
-
Mechanistic Insights and Therapeutic Delivery through Micro/Nanobubble-Assisted Ultrasound.Pharmaceutics. 2022 Feb 22;14(3):480. doi: 10.3390/pharmaceutics14030480. Pharmaceutics. 2022. PMID: 35335857 Free PMC article. Review.
-
The use of RNA-based treatments in the field of cancer immunotherapy.Mol Cancer. 2023 Jul 7;22(1):106. doi: 10.1186/s12943-023-01807-w. Mol Cancer. 2023. PMID: 37420174 Free PMC article. Review.
-
Ultrasound-targeted microbubble destruction mediated miR-492 inhibitor suppresses the tumorigenesis in non-small cell lung cancer.Ann Med. 2021 Dec;53(1):2246-2255. doi: 10.1080/07853890.2021.2005254. Ann Med. 2021. PMID: 34818961 Free PMC article.
-
Low- and high-protein diets do not alter ex vivo insulin action in skeletal muscle.Physiol Rep. 2018 Jul;6(13):e13798. doi: 10.14814/phy2.13798. Physiol Rep. 2018. PMID: 29998629 Free PMC article.
References
-
- Amin RH, Mathews ST, Camp HS, Ding L, Leff T. Selective activation of PPARgamma in skeletal muscle induces endogenous production of adiponectin and protects mice from diet-induced insulin resistance. Am J Physiol Endocrinol Metab 298: E28–E37, 2010 - PubMed
-
- Bekeredjian R, Chen S, Frenkel PA, Grayburn PA, Shohet RV. Ultrasound-targeted microbubble destruction can repeatedly direct highly specific plasmid expression to the heart. Circulation 108: 1022–1026, 2003 - PubMed
-
- Bekeredjian R, Grayburn PA, Shohet RV. Use of ultrasound contrast agents for gene or drug delivery in cardiovascular medicine. J Am Coll Cardiol 45: 329–335, 2005 - PubMed
-
- Bonnard C, Durand A, Vidal H, Rieusset J. Changes in adiponectin, its receptors and AMPK activity in tissues of diet-induced diabetic mice. Diabetes Metab 34: 52–61, 2008 - PubMed
Publication types
MeSH terms
Substances
Grants and funding
LinkOut - more resources
Full Text Sources
Other Literature Sources

