. 2013 Feb;31(2):327-37.
doi: 10.1002/stem.1275.

Tie2(+) bone marrow endothelial cells regulate hematopoietic stem cell regeneration following radiation injury

Affiliations

Tie2(+) bone marrow endothelial cells regulate hematopoietic stem cell regeneration following radiation injury

Phuong L Doan et al. Stem Cells. 2013 Feb.

Abstract

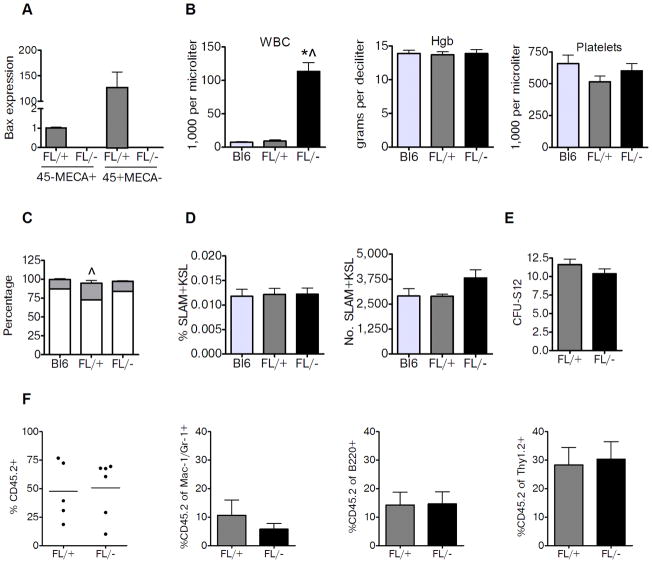
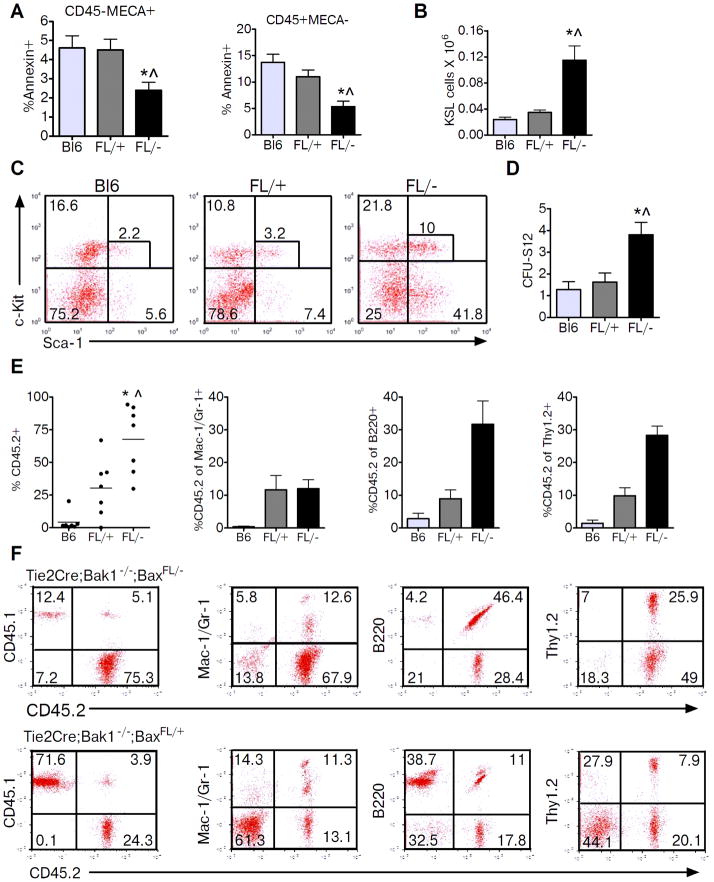
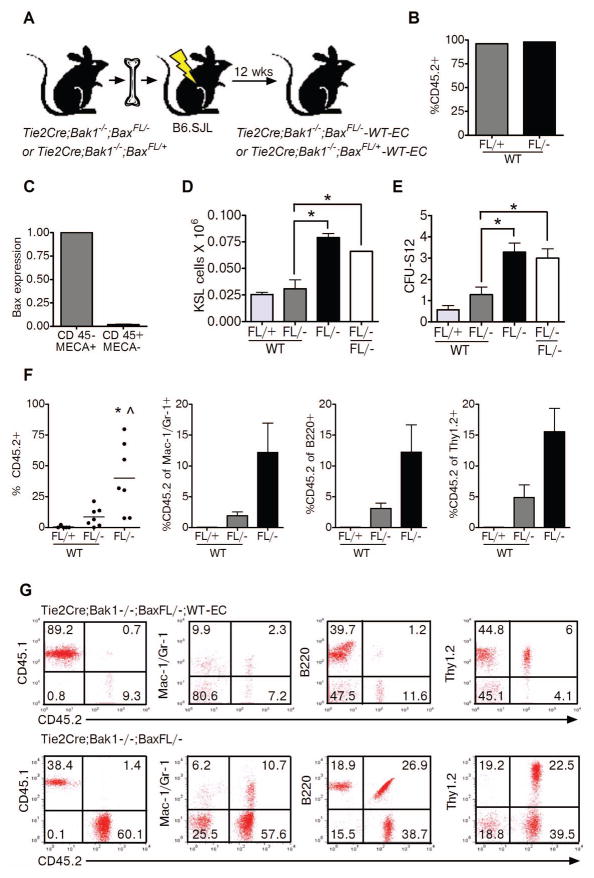
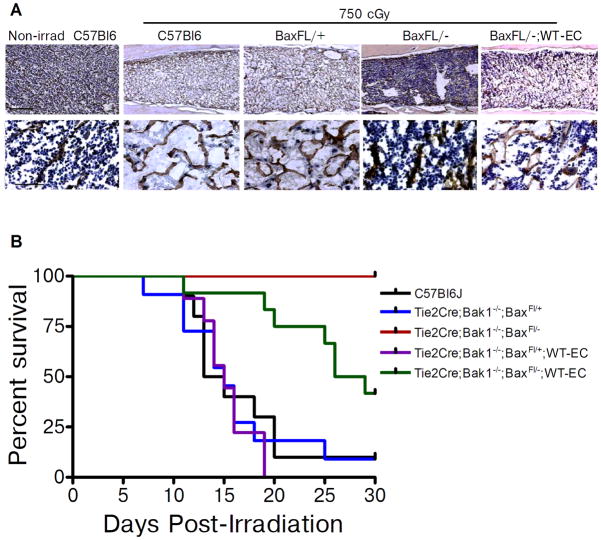
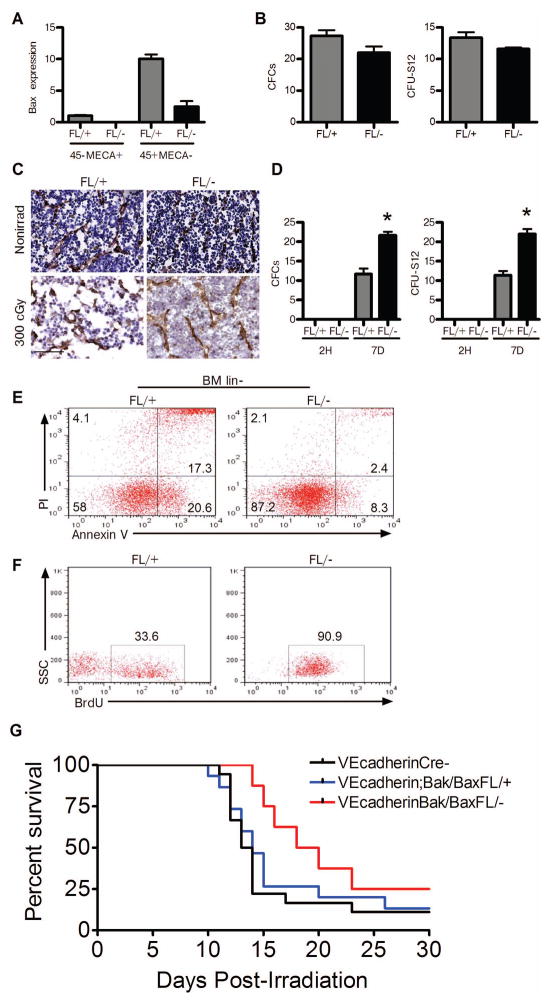
Hematopoietic stem cells (HSCs) reside in proximity to bone marrow endothelial cells (BM ECs) and maintenance of the HSC pool is dependent upon EC-mediated c-kit signaling. Here, we used genetic models to determine whether radioprotection of BM ECs could facilitate hematopoietic regeneration following radiation-induced myelosuppression. We developed mice bearing deletion of the proapoptotic proteins, BAK and BAX, in Tie2(+) ECs and HSCs (Tie2Bak/Bax(Fl/-) mice) and compared their hematopoietic recovery following total body irradiation (TBI) with mice which retained Bax in Tie2(+) cells. Mice bearing deletion of Bak and Bax in Tie2(+) cells demonstrated protection of BM HSCs, preserved BM vasculature, and 100% survival following lethal dose TBI. In contrast, mice that retained Bax expression in Tie2(+) cells demonstrated depletion of BM HSCs, disrupted BM vasculature, and 10% survival post-TBI. In a complementary study, VEcadherinBak/Bax(Fl/-) mice, which lack Bak and Bax in VEcadherin(+) ECs, also demonstrated increased recovery of BM stem/progenitor cells following TBI compared to mice which retained Bax in VEcadherin(+) ECs. Importantly, chimeric mice that lacked Bak and Bax in HSCs but retained Bak and Bax in BM ECs displayed significantly decreased HSC content and survival following TBI compared to mice lacking Bak and Bax in both HSCs and BM ECs. These data suggest that the hematopoietic response to ionizing radiation is dependent upon HSC-autonomous responses but is regulated by BM EC-mediated mechanisms. Therefore, BM ECs may be therapeutically targeted as a means to augment hematopoietic reconstitution following myelosuppression.


Conflict of interest statement

DISCLOSURE OF POTENTIAL CONFLICTS OF INTEREST: Dr. John Chute is a scientific advisor to Becton Dickinson (Durham, NC).

Figures

Figure 1
Figure 1
Deletion of Bak and Bax in Tie2+ cells does not alter baseline HSC content or function. (A) Endothelial cells (CD45MECA+) and hematopoietic cells (CD45+MECA) were isolated from the BM. Relative expression of Bax is shown in these cell populations from Tie2Bak/BaxFL/− mice (FL/−), Tie2Bak/BaxFL/+ mice (FL/+)(n=4–7/group). (B) Peripheral blood cells from 8 week old C57Bl6 (Bl6) mice, FL/+ mice and FL/− mice were analyzed for WBCs, hemoglobin (Hgb) concentration, and platelet counts. FL/− mice had significantly higher PB WBCs compared to control mice (n=5/group). *P<0.001 and ^P<0.001 versus FL/+ and Bl6 mice; means ± SEM. (C) Percentage of PB lymphocytes (gray) and neutrophils (white) is shown between non-irradiated Bl6 mice, FL/+ mice and FL/− mice (n=5/group). ^P=0.02 for lymphocyte percentage between FL/+ and FL/− mice. (D) Percentages of CD150+CD48CD41KSL cells (SLAM+KSL cells) and total numbers of SLAM+KSL cells per femur in the BM of non-irradiated Bl6, FL/+ and FL/− mice are shown (n=3–4/group). (E) Numbers of BM CFU-S12 in non-irradiated FL/+ and FL/− mice are shown (n=6–8/group). (F) Scatter plots show the donor CD45.2+ cell engraftment in recipient CD45.1+ mice at 12 weeks following competitive transplantation with 3 × 10⁴ BM cells from non-irradiated FL/− or FL/+ mice with 1 × 10⁵ competing B6.SJL (CD45.1+) BM cells (n=5–6/group). Mean levels of engraftment are represented by the horizontal lines (mean 50.8% vs. 47.5% CD45.2+ cells in PB at 12 weeks. The mean percentages of donor CD45.2+ cells within the myeloid (Mac-1/Gr-1), B cell (B220) and T cell (Thy 1.2) cell populations at 12 weeks are shown at right.
Figure 2
Figure 2
Deletion of Bak and Bax in Tie2+ cells protects BM HSCs and progenitor cells from radiation injury. (A) Percentages of Annexin+ cells are shown for BM ECs (CD45MECA+, left) and BM hematopoietic cells (CD45+MECA, right) in BL6, FL/+ and FL/− mice at 2 hours after 300 cGy TBI (n=3–5/group). *P=0.04 and ^P=0.04 versus Bl6 and FL/+ for CD45MECA+ cells, respectively. *P=0.009 and ^P=0.03 versus Bl6 and FL/+ for CD45+MECA cells, respectively. (B) Bl6, FL/+ and FL/− mice were irradiated with 300 cGy TBI and BM cells were collected at +2 hours post-irradiation. BM KSL cells per femur were increased in FL/− mice compared to control mice (n=3–7/group). *P=0.006 and ^P=0.006 versus Bl6 and FL/+ mice, respectively. (C) Representative flow cytometric analysis of BM KSL cells in Bl6, FL/+, and FL/− mice following 300 cGy TBI. (D) BM CFU-S12 content was increased in FL/− mice compared to control mice. *P=0.003 and ^P=0.01 versus Bl6 and FL/+ mice, respectively (means ± SEM, n=6–8/group). (E) Scatter plots show the PB engraftment at 12 weeks post-transplant of donor BM CD45.2+ cells that were harvested from FL/− or FL/+ mice at +2 hours following 300 cGy and competitively transplanted at a dose of 3 × 10⁵ BM cells into lethally irradiated CD45.1+ recipient mice with 1 × 10⁵ non-irradiated host competitor BM cells. PB engraftment of the same dose of donor BM CD45.2+ cells harvested from irradiated Bl6 mice following transplant into lethally irradiated CD45.1+ recipient mice is shown at left. Each dot represents the engraftment of an individual mouse. Lines represent the mean levels of engraftment in each group (B6: 4.2%, FL/+: 30.4%, FL/−: 67.7%, n=7/group). The mean percentages of donor CD45.2+ cells within the myeloid, B cell and T cell populations at 12 weeks are shown at right. (F) Representative flow cytometric analysis of CD45.2+ donor cell engraftment at 12 weeks in recipients ofTie2Bak/BaxFL/− or Tie2Bak/BaxFL/+ BM cells.
Figure 3
Figure 3
(A) Schematic representation of the BM transplant model utilized to generate chimeric mice bearing deletion of Bak and Bax in Tie2+ hematopoietic cells while retaining Bak and Bax in BM ECs (Tie2Bak/BaxFL/−;WT-EC mice), along with control mice. (B) Mean levels ± SEM of CD45.2+ donor cell engraftment are shown in the PB of recipient CD45.1+ mice at 12 weeks following transplantation of BM cells from FL/+ and FL/− mice (n=4–5 mice/group). (C) Relative expression of Bax is shown in FACS-isolated CD45MECA+ BM ECs and CD45+MECA BM hematopoietic cells in recipient B6.SJL mice at 12 weeks following transplant with BM cells from Tie2Bak/BaxFL/− mice (means ± SEM, n=2). (D) BM KSL cells per femur were decreased in Tie2Bak/BaxFL/−;WT-EC mice (FL/−;WT) compared to Tie2Bak/BaxFL/− mice (FL/−) and Tie2Bak/BaxFL/−;FL-EC (FL/−;FL/−) mice following 300 cGy TBI. *P=0.007 and *P=0.046 for KSL cells in FL/−;WT-EC mice versus FL/− and FL/−;FL/− mice, respectively (means + SEM, n=2–3). (E) BM CFU-S12 were also significantly decreased in FL/−;WT mice compared to FL/− and FL/−;FL/− mice. *P=0.004 and *P=0.01 for CFU-S12 in FL/−;WT mice versus FL/− and FL/−;FL/− mice, respectively (means ± SEM, n=7). No significant differences were noted in BM KSL cells or CFU-S12 in FL/− mice compared to FL/−;FL/− mice. (F) The scatter plots show donor CD45.2+ cell engraftment in the PB at 12 weeks following competitive transplantation of 1 × 10⁵ BM cells from irradiated FL/+;WT mice, FL/−;WT mice or FL/− mice into lethally irradiated CD45.1+ recipient mice. Each dot represents the engraftment of an individual mouse. Horizontal lines represent the mean levels of engraftment (FL/+;WT-EC: 0.1%, FL/−;WT-EC: 8.5%, FL/−: 40.0%, n=5–7/group). The mean percentages of donor CD45.2+ cells within the myeloid, B cell and T cell populations are shown at right. (G) Representative flow cytometric analysis of donor CD45.2+ cell engraftment and differentiation in recipient mice after transplantation with BM from irradiated FL/−;WT mice or FL/− mice.
Figure 4
Figure 4
Deletion of Bak and Bax in Tie2+ ECs preserves BM cellularity and improves survival following high dose TBI. (A) Representative cross sections of femurs from non-irradiated C57Bl6 mice and from C57Bl6 mice, Tie2Bak/BaxFL/+ mice (BaxFL/+), Tie2Bak/BaxFL/− mice (BaxFL/−) and Tie2Bak/BaxFL/−;WT-EC mice (BaxFL/−;WT-EC) at day +10 following 750 cGy TBI. Hematoxylin and mouse endothelial cell antigen (MECA) staining was performed. MECA-positive vessels are shown in brown (top, scale bar 250 microns; bottom, 50 microns), demonstrating preservation of BM sinusoidal vasculature in BaxFL/− mice and disruption of the vasculature in BaxFL/−;WT-EC mice, BaxFL/+ mice and C57Bl6 mice. The BaxFL/− mice also demonstrated substantially increased BM cellularity compared to BaxFL/−;WT-EC mice, C57Bl6 mice and BaxFL/+ mice. (B) Deletion of Bak and Bax in Tie2+ ECs improved the survival of mice exposed to lethal dose TBI. Adult C57Bl6 mice and mice bearing deletions of Bak and Bax (identified at top) were irradiated with 750 cGy TBI and subsequently followed for 30 days (n=9–12/group). Tie2Bak/BaxFL/− mice demonstrated 100% survival (10 of 10), compared to 10% survival (1 of 10) for C57Bl6 mice (P<0.0001) and 9% survival (1 of 11) for Tie2Bak/BaxFL/+ mice (P<0.0001). Tie2Bak/BaxFL/−;WT-EC mice (BaxFL/−;WT-EC) demonstrated significantly decreased survival (42%, 5 of 12) compared to Tie2Bak/BaxFL/− mice (*P=0.005), but significantly increased survival compared to Tie2Bak/BaxFL/+;WT-EC mice (BaxFL/+;WT EC) (0 of 9, P<0.0001). Log rank test was performed for all comparisons.
Figure 5
Figure 5
Deletion of Bak and Bax in VEcadherin+ ECs promotes BM hematopoietic stem/progenitor cell regeneration in vivo. (A) Relative expression of Bax is shown in BM ECs (CD45MECA+) and hematopoietic cells (CD45+MECA) in VEcadherinBak/BaxFL/+ mice (FL/+) and VEcadherinBak/BaxFL/− mice (FL/−) (n=3/group). Bax was not detected in CD45MECA+ ECs from FL/− mice but was detected in CD45+MECA hematopoietic cells from FL/− mice. (B) Non-irradiated FL/+ and FL/− mice demonstrated comparable BM CFC and CFU-S12 content. (C) Representative cross sections of femurs are shown from non-irradiated VEcadherinBak/BaxFL/+ mice (FL/+) and VEcadherinBak/BaxFL/− mice (FL/−) and at day +7 following 300 cGy TBI. Mouse endothelial cell antigen (brown) and hematoxylin (blue) stained femurs showed similar BM vasculature and cellularity in non-irradiated mice. After 300 cGy, the FL/+ mice had significant disruption of the BM sinusoidal vasculature and decreased BM cellularity compared to FL/− mice. Scale bar is 50 microns. (D) FL/− and FL/+ mice were irradiated with 300 cGy TBI and BM cells were collected at 2 hours post-TBI and at day +7 for measurement of hematopoietic progenitor cell content. No differences were observed at 2 hours post-TBI in BM CFCs or CFU-S12 (n=3–5/group). At day +7 post TBI, mean numbers of BM CFCs and BM CFU-S12 were significantly increased in FL/− mice compared to FL/+ mice (n=3–5/group). *P=0.004 versus FL/+ for CFCs and *P=0.0002 versus FL/+ for CFU-S12. (E) Flow cytometric analysis demonstrated decreased apoptotic (Annexin+PI) and necrotic (Annexin+PI+) BM lin hematopoietic cells in FL/− mice at day +7 post TBI compared to FL/+ mice. (F) BrdU incorporation was increased in BM KSL progenitor cells in FL/− mice compared to FL/+ mice at day +7 following TBI. (G) Survival of VEcadherinBak/BaxFl/− mice (n=8), VEcadherinBak/BaxFl/+ mice (n=15) and VEcadherinCre (−) mice (n=18) following lethal dose TBI. Survival curves of VEcadherinBak/BaxFL/− mice (red line), VEcadherinBak/BaxFL/+ mice (blue line) and VEcadherinCre (−) mice (black line) are shown following 750 cGy TBI (15-day survival: P=0.04 and P=0.004 for VEcadherinBak/BaxFl/− mice vs. VEcadherinBak/BaxFl/+ mice and VEcadherinCre (−) mice, respectively, Fisher’s exact test; 30-day survival analysis: P=0.07 and P=0.06 for VEcadherinBak/BaxFl/− mice vs. VEcadherinBak/BaxFl/+ mice and VEcadherinCre (−) mice, respectively, Log Rank analysis.
Figure 6
Figure 6
Cytokine concentrations in the BM of non-irradiated Tie2Bak/BaxFl/− mice.Cytokines are shown which were upregulated (filled bars) or downregulated (unfilled bars) ≥ 3-fold in the BM of non-irradiated Tie2Bak/BaxFl/− mice (FL/−) versus Tie2Bak/BaxFl/+ mice (FL/+) (A) and ≥ 5-fold in non-irradiated FL/− versus C57Bl6 mice (B, P<0.05 for each cytokine). VEGF-D=vascular endothelial growth factor-D, IGFBP2=insulin like growth factor binding protein 2, GITR=glucocorticoid-induced TNFR-related protein, IL-17f=interleukin-17f, SDF1a=stromal derived factor 1a, AR=amphiregulin, IFNg=interferon gamma, KC=keratinocyte chemoattractant, MIG=migration inhibitory factor, MIP1a=macrophage inflammatory protein 1a, FasL=Fas ligand, TARC=thymus and activation regulated chemokine, RANTES=regulated and normal T cell expressed and secreted protein, bFGF=beta fibroblast growth factor
Figure 7
Figure 7
Cytokine concentrations in the BM of irradiated Tie2Bak/BaxFl/− mice. Cytokines which were upregulated or downregulated ≥ 3-fold at 6 hours following 750 cGy in the BM of FL/−-versus FL/+ mice (A) and ≥ 5-fold in FL/− versus C57Bl6 mice (B) are also shown. TNF RII=tumor necrosis factor receptor II, LIX=lipopolysaccharide-induced CXC chemokine, HGF=hepatocyte growth factor, OPG=osteoprotegerin, BLC=B lymphocyte chemoattractant

Similar articles

Cited by

References

    1. Calvi LM, Adams GB, Weibrecht KW, et al. Osteoblastic cells regulate the haematopoietic stem cell niche. Nature. 2003;425:841–846. - PubMed
    1. Adams GB, Martin RP, Alley IR, et al. Therapeutic targeting of a stem cell niche. Nat Biotechnol. 2007;25:238–243. - PubMed
    1. Arai F, Hirao A, Ohmura M, et al. Tie2/angiopoietin-1 signaling regulates hematopoietic stem cell quiescence in the bone marrow niche. Cell. 2004;118:149–161. - PubMed
    1. Kiel MJ, Yilmaz OH, Iwashita T, et al. SLAM family receptors distinguish hematopoietic stem and progenitor cells and reveal endothelial niches for stem cells. Cell. 2005;121:1109–1121. - PubMed
    1. Sugiyama T, Kohara H, Noda M, et al. Maintenance of the hematopoietic stem cell pool by CXCL12-CXCR4 chemokine signaling in bone marrow stromal cell niches. Immunity. 2006;25:977–988. - PubMed

Publication types

MeSH terms