

Characteristics and significance of intergenic polyadenylated RNA transcription in Arabidopsis
- PMID: 23132786
- PMCID: PMC3532253
- DOI: 10.1104/pp.112.205245
Characteristics and significance of intergenic polyadenylated RNA transcription in Arabidopsis
Abstract
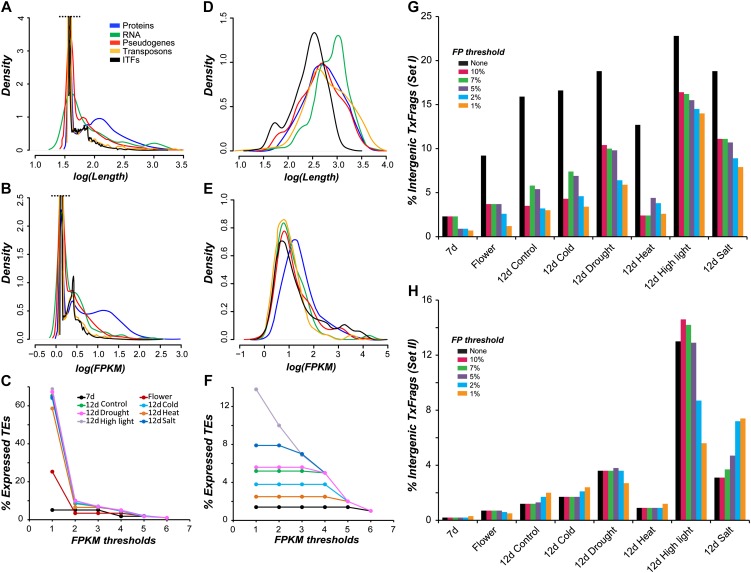
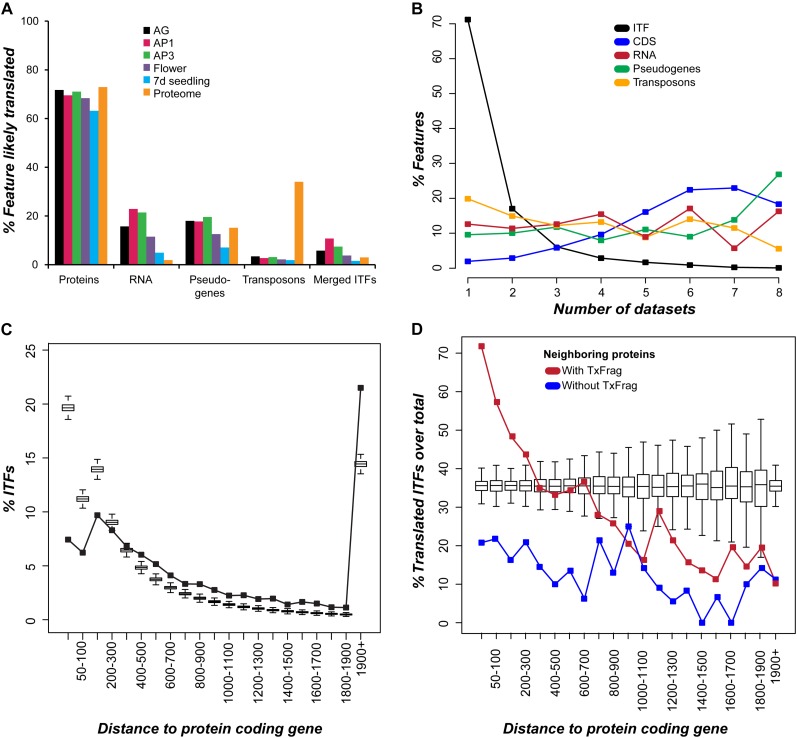
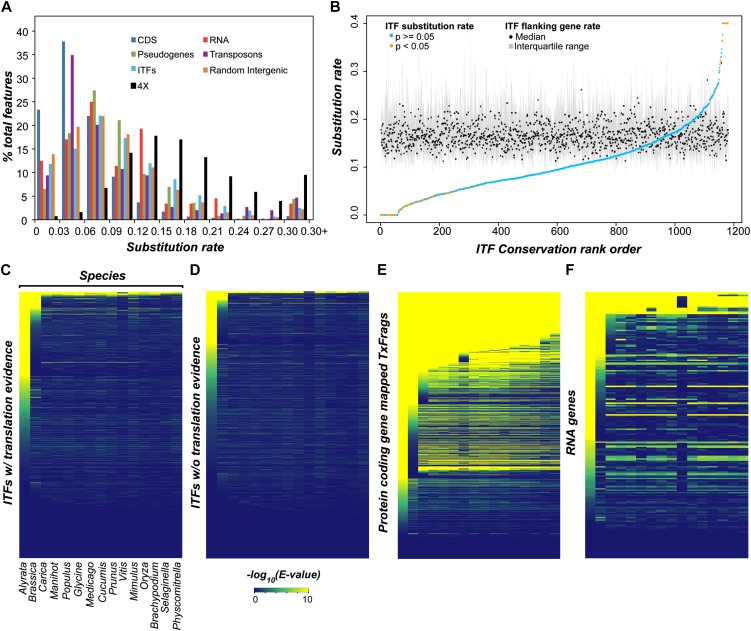
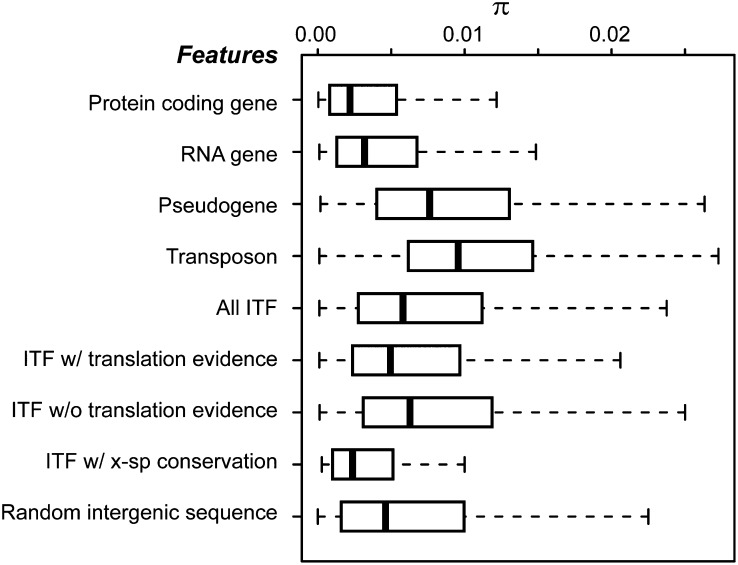
The Arabidopsis (Arabidopsis thaliana) genome is the most well-annotated plant genome. However, transcriptome sequencing in Arabidopsis continues to suggest the presence of polyadenylated (polyA) transcripts originating from presumed intergenic regions. It is not clear whether these transcripts represent novel noncoding or protein-coding genes. To understand the nature of intergenic polyA transcription, we first assessed its abundance using multiple messenger RNA sequencing data sets. We found 6,545 intergenic transcribed fragments (ITFs) occupying 3.6% of Arabidopsis intergenic space. In contrast to transcribed fragments that map to protein-coding and RNA genes, most ITFs are significantly shorter, are expressed at significantly lower levels, and tend to be more data set specific. A surprisingly large number of ITFs (32.1%) may be protein coding based on evidence of translation. However, our results indicate that these "translated" ITFs tend to be close to and are likely associated with known genes. To investigate if ITFs are under selection and are functional, we assessed ITF conservation through cross-species as well as within-species comparisons. Our analysis reveals that 237 ITFs, including 49 with translation evidence, are under strong selective constraint and relatively distant from annotated features. These ITFs are likely parts of novel genes. However, the selective pressure imposed on most ITFs is similar to that of randomly selected, untranscribed intergenic sequences. Our findings indicate that despite the prevalence of ITFs, apart from the possibility of genomic contamination, many may be background or noisy transcripts derived from "junk" DNA, whose production may be inherent to the process of transcription and which, on rare occasions, may act as catalysts for the creation of novel genes.
Figures
Similar articles
-
Transcription-related mutations and GC content drive variation in nucleotide substitution rates across the genomes of Arabidopsis thaliana and Arabidopsis lyrata.BMC Evol Biol. 2007 Apr 23;7:66. doi: 10.1186/1471-2148-7-66. BMC Evol Biol. 2007. PMID: 17451608 Free PMC article.
-
A large number of novel coding small open reading frames in the intergenic regions of the Arabidopsis thaliana genome are transcribed and/or under purifying selection.Genome Res. 2007 May;17(5):632-40. doi: 10.1101/gr.5836207. Epub 2007 Mar 29. Genome Res. 2007. PMID: 17395691 Free PMC article.
-
The Arabidopsis thaliana ACT4/ACT12 actin gene subclass is strongly expressed throughout pollen development.Plant J. 1996 Aug;10(2):189-202. doi: 10.1046/j.1365-313x.1996.10020189.x. Plant J. 1996. PMID: 8771777
-
Silencing the transcriptome's dark matter: mechanisms for suppressing translation of intergenic transcripts.Mol Cell. 2006 May 5;22(3):309-16. doi: 10.1016/j.molcel.2006.04.010. Mol Cell. 2006. PMID: 16678103 Review.
-
An evolutionary classification of genomic function.Genome Biol Evol. 2015 Jan 28;7(3):642-5. doi: 10.1093/gbe/evv021. Genome Biol Evol. 2015. PMID: 25635041 Free PMC article. Review.
Cited by
-
Non-Coding RNAs and their Integrated Networks.J Integr Bioinform. 2019 Jul 13;16(3):20190027. doi: 10.1515/jib-2019-0027. J Integr Bioinform. 2019. PMID: 31301674 Free PMC article. Review.
-
Genome-wide characterization of intergenic polyadenylation sites redefines gene spaces in Arabidopsis thaliana.BMC Genomics. 2015 Jul 9;16(1):511. doi: 10.1186/s12864-015-1691-1. BMC Genomics. 2015. PMID: 26155789 Free PMC article.
-
Deep analysis of wild Vitis flower transcriptome reveals unexplored genome regions associated with sex specification.Plant Mol Biol. 2017 Jan;93(1-2):151-170. doi: 10.1007/s11103-016-0553-9. Epub 2016 Oct 24. Plant Mol Biol. 2017. PMID: 27778293
-
Identification and functional annotation of long intergenic non-coding RNAs in Brassicaceae.Plant Cell. 2022 Aug 25;34(9):3233-3260. doi: 10.1093/plcell/koac166. Plant Cell. 2022. PMID: 35666179 Free PMC article.
-
Robust predictions of specialized metabolism genes through machine learning.Proc Natl Acad Sci U S A. 2019 Feb 5;116(6):2344-2353. doi: 10.1073/pnas.1817074116. Epub 2019 Jan 23. Proc Natl Acad Sci U S A. 2019. PMID: 30674669 Free PMC article.
References
-
- Armour CD, Castle JC, Chen R, Babak T, Loerch P, Jackson S, Shah JK, Dey J, Rohl CA, Johnson JM, et al. (2009) Digital transcriptome profiling using selective hexamer priming for cDNA synthesis. Nat Methods 6: 647–649 - PubMed
-
- Aubourg S, Martin-Magniette M-L, Brunaud V, Taconnat L, Bitton F, Balzergue S, Jullien PE, Ingouff M, Thareau V, Schiex T, et al. (2007) Analysis of CATMA transcriptome data identifies hundreds of novel functional genes and improves gene models in the Arabidopsis genome. BMC Genomics 8: 401. - PMC - PubMed
-
- Baerenfaller K, Grossmann J, Grobei MA, Hull R, Hirsch-Hoffmann M, Yalovsky S, Zimmermann P, Grossniklaus U, Gruissem W, Baginsky S. (2008) Genome-scale proteomics reveals Arabidopsis thaliana gene models and proteome dynamics. Science 320: 938–941 - PubMed
-
- Bailey-Serres J, Sorenson R, Juntawong P. (2009) Getting the message across: cytoplasmic ribonucleoprotein complexes. Trends Plant Sci 14: 443–453 - PubMed
Publication types
MeSH terms
Substances
LinkOut - more resources
Full Text Sources
