

Binding of the N-terminal region of coactivator TIF2 to the intrinsically disordered AF1 domain of the glucocorticoid receptor is accompanied by conformational reorganizations
- PMID: 23132854
- PMCID: PMC3531768
- DOI: 10.1074/jbc.M112.411330
Binding of the N-terminal region of coactivator TIF2 to the intrinsically disordered AF1 domain of the glucocorticoid receptor is accompanied by conformational reorganizations
Abstract
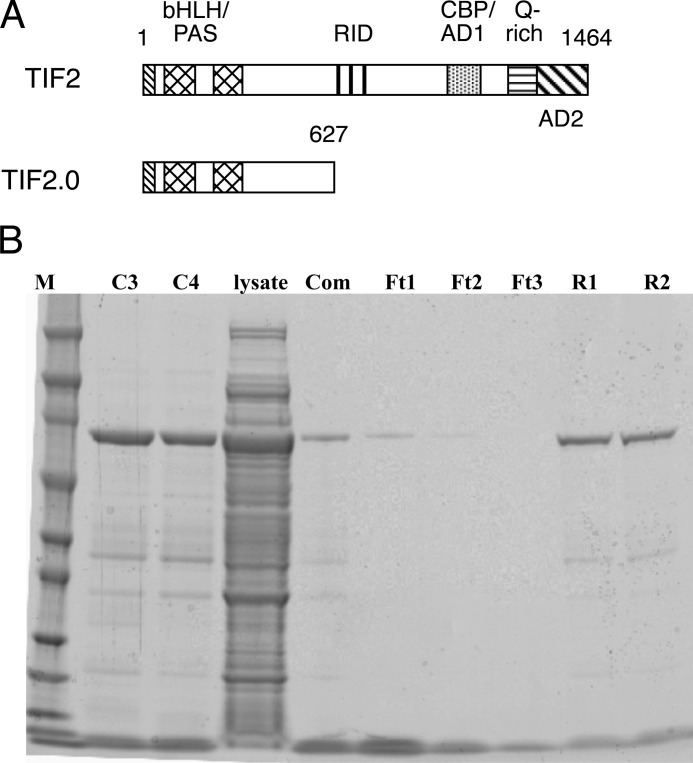
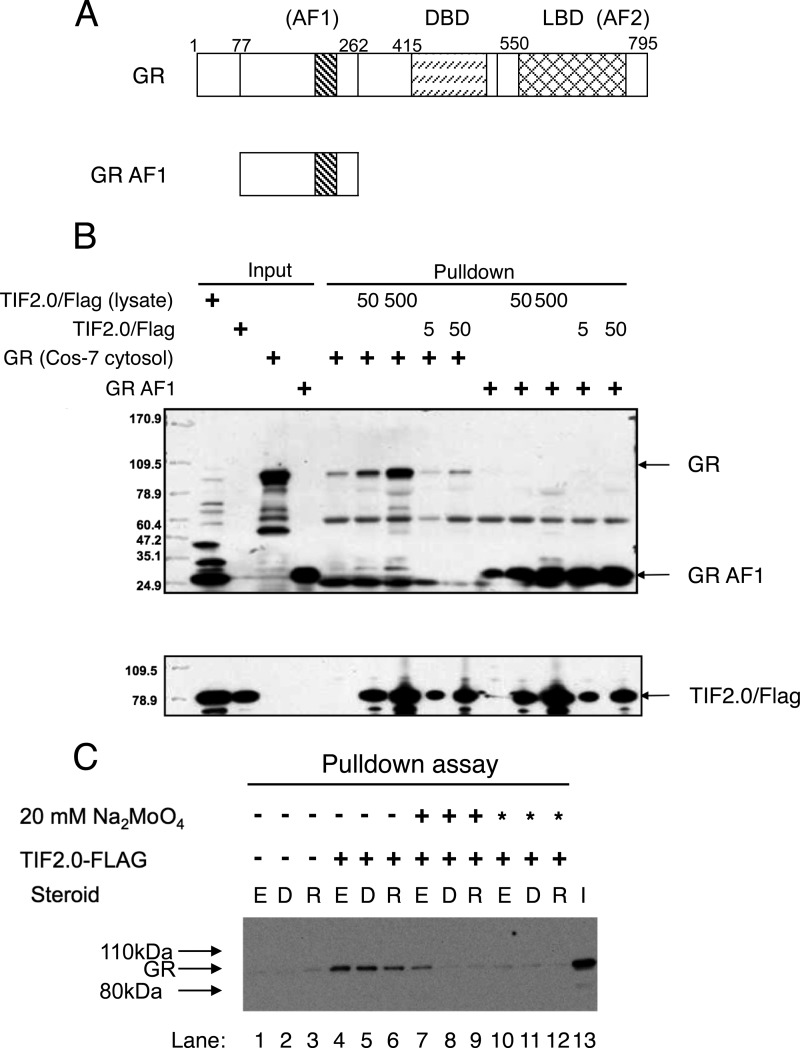
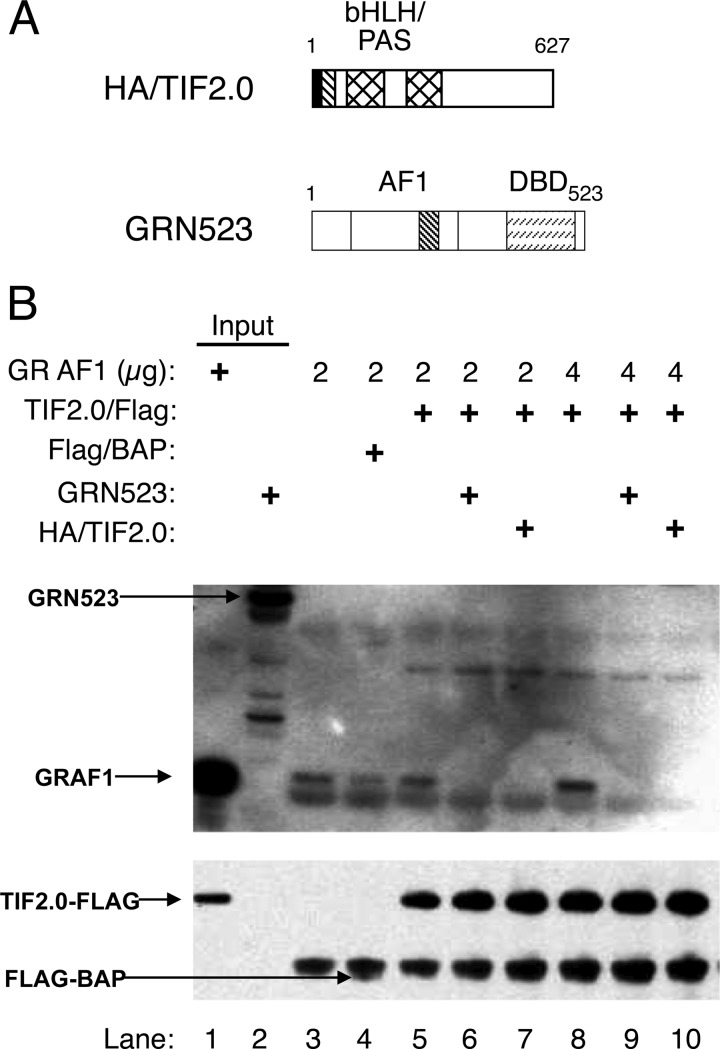
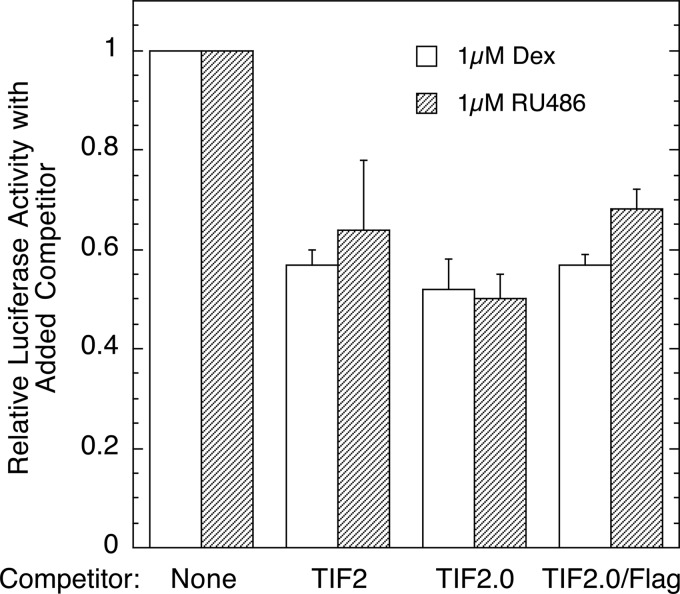
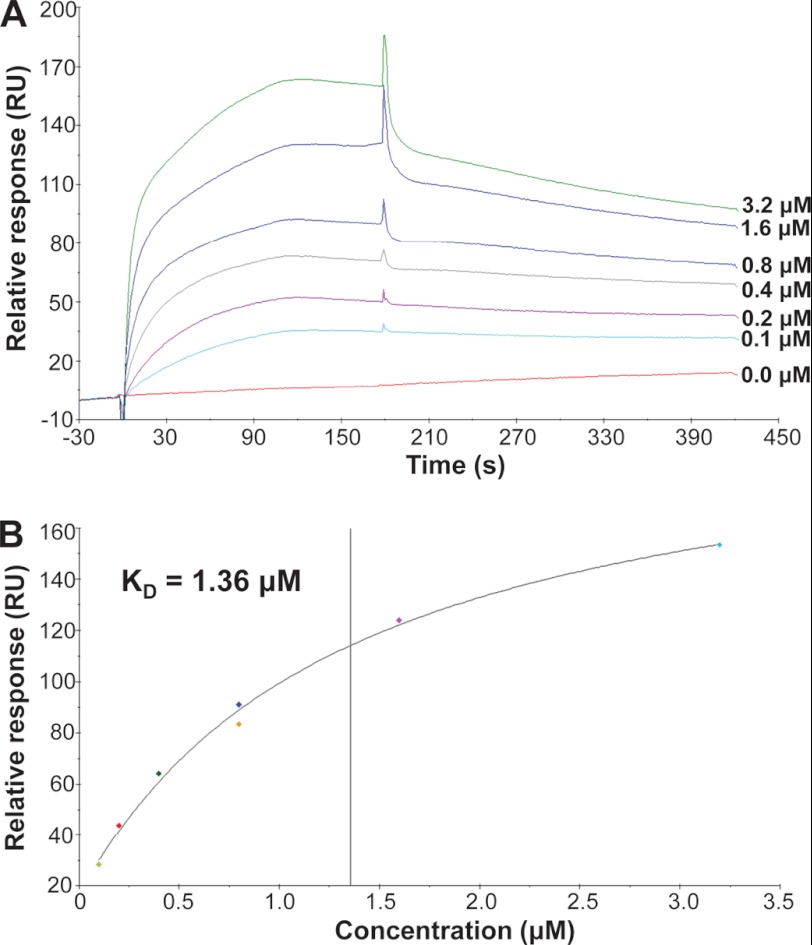
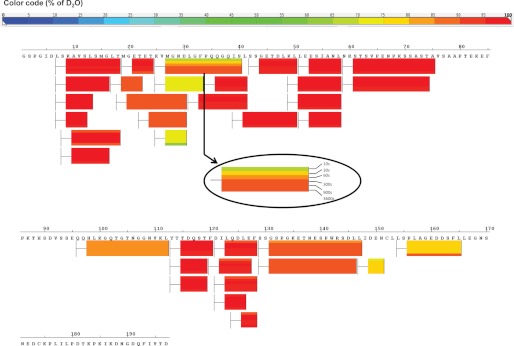
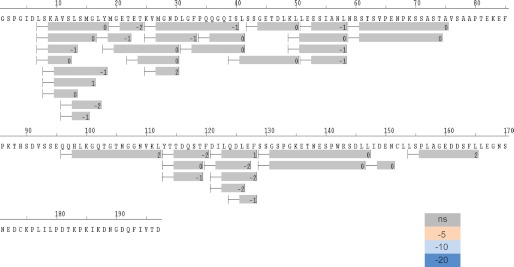
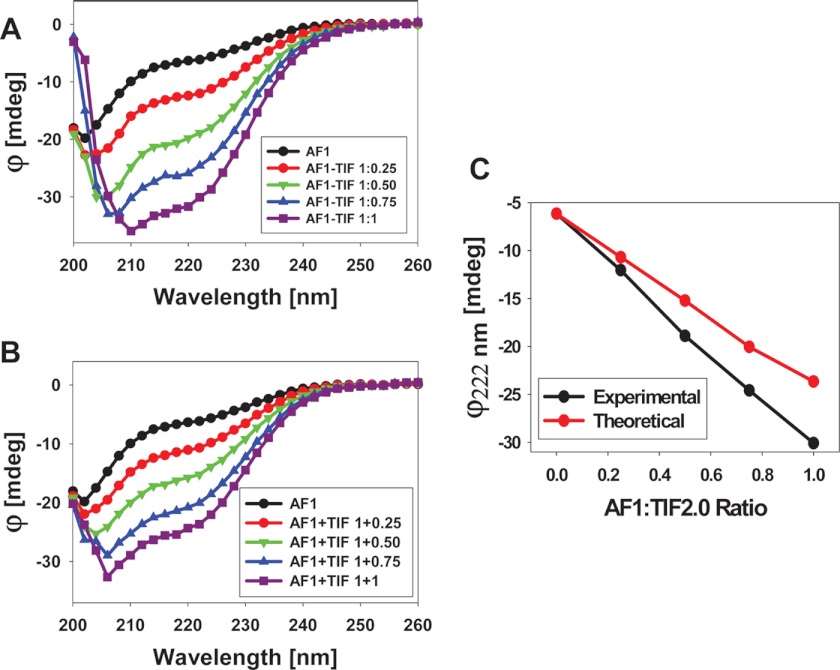
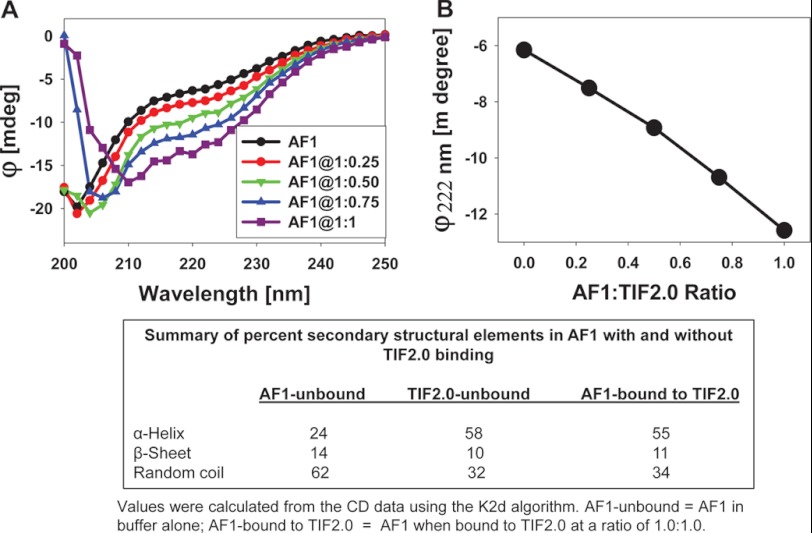
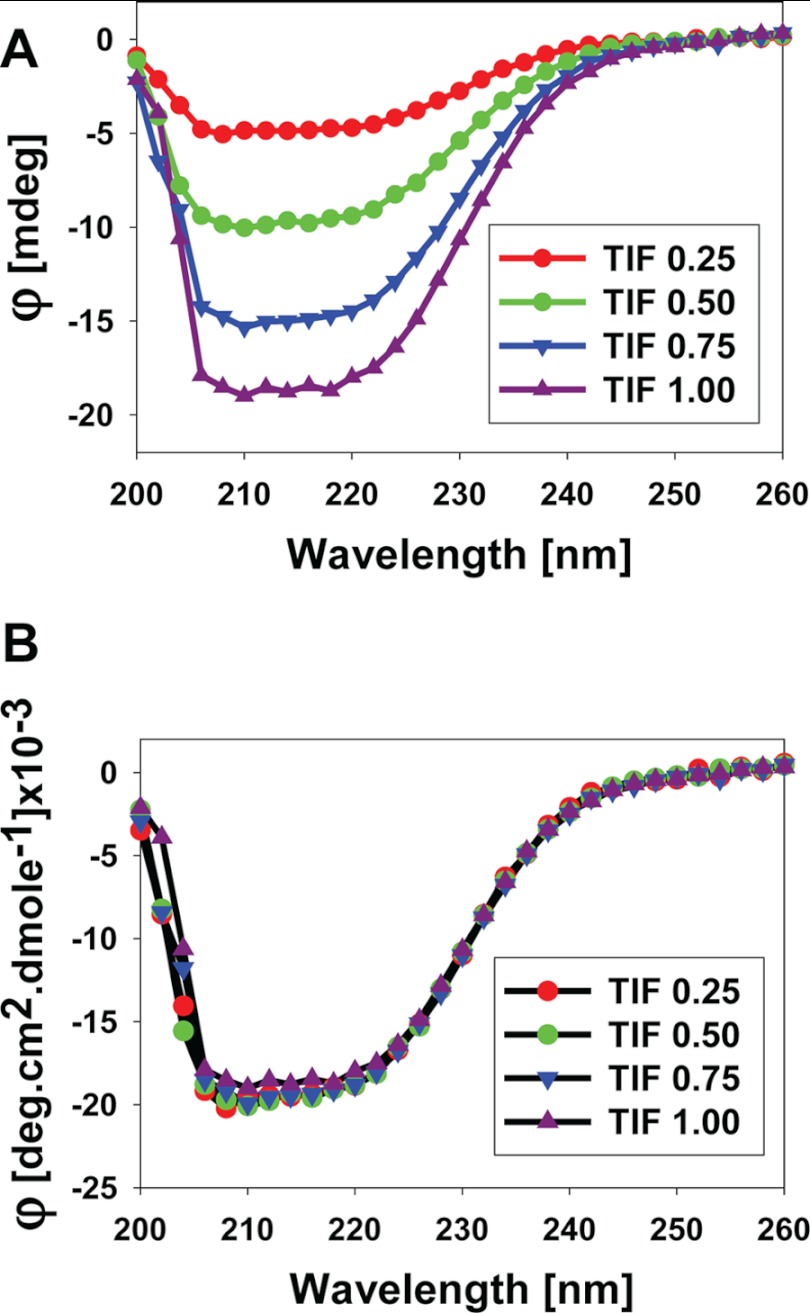
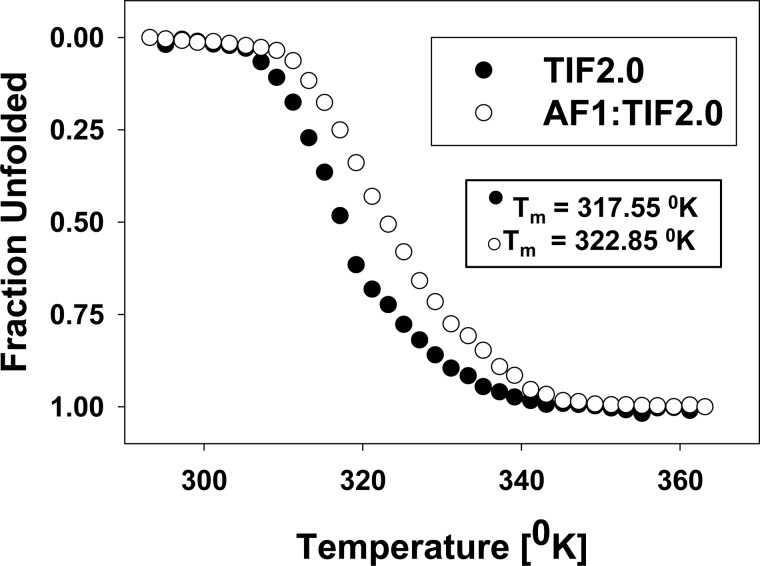
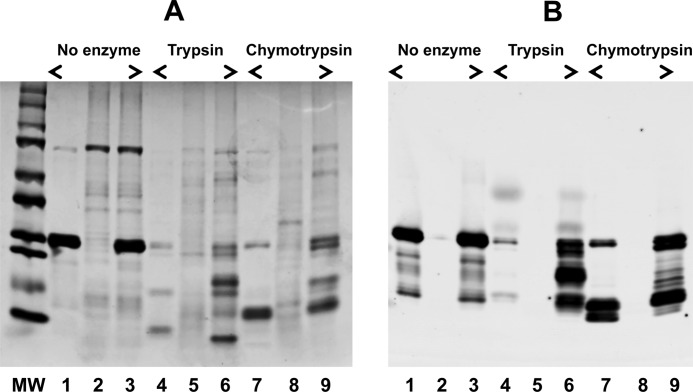
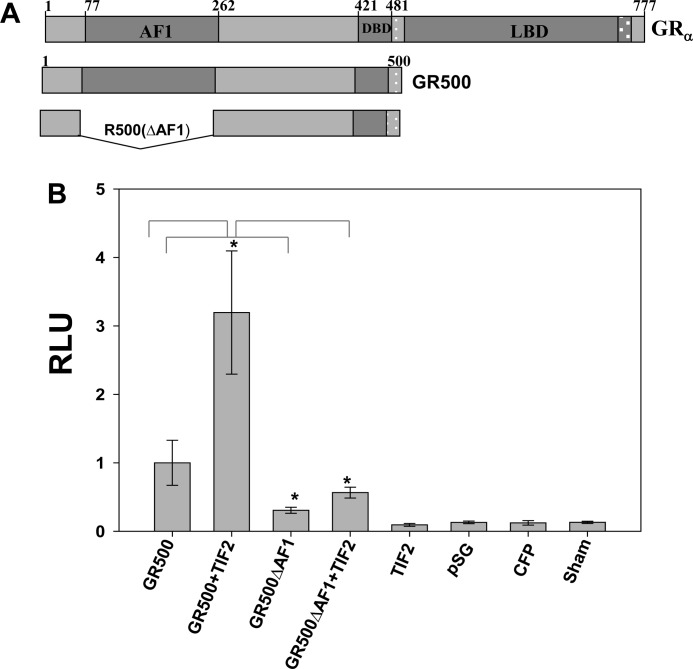
Control of gene transcription by glucocorticoid receptors (GRs) is important for many physiological processes. Like other steroid hormone receptors, the regulation of target genes by GR is mediated by two transactivation domains: activation function 1 (AF1) in the N-terminal domain and AF2 in the C-terminal ligand-binding domain (LBD). Full receptor activity requires both AF1 and -2 plus assorted coregulatory proteins. Crystal structures of the ligand-bound LBD have provided insight regarding how AF2 interacts with specific coactivators. However, despite its being the major activation domain of GRs, knowledge of AF1 structure/function has languished. This is mainly because of the highly disorganized structure of the GR N-terminal domain. This lack of AF1 structure is shared by all members of the steroid/nuclear receptor superfamily for which it has been examined and AF1 is thought to allow productive interactions with assorted cofactors via protein-induced changes in secondary/tertiary structures. To date, there are no reports of a classical coactivator altering the secondary/tertiary structure of the GR AF1 domain. Earlier, we reported an N-terminal fragment of the p160 coactivator TIF2, called TIF2.0, that binds the GR N-terminal domain and alters GR transcriptional activity. We therefore proposed that TIF2.0 binding to AF1 changes both its conformation and transcriptional activity. We now report that TIF2.0 interacts with the GR AF1 domain to increase the amount of α-helical structure in the complex. Furthermore, TIF2 coactivator activity is observed in the absence of the GR LBD in a manner that requires the AF1 domain. This contrasts with previous models where TIF2 receptor interaction domains binding to GR LBD somehow alter AF1 conformation. Our results establish for the first time that coactivators can modify the structure of the AF1 domain directly via the binding of a second region of the coactivator and suggest a molecular explanation for how coactivators increase the transcriptional activity of GR-agonist complexes.
Figures
Similar articles
-
TBP binding-induced folding of the glucocorticoid receptor AF1 domain facilitates its interaction with steroid receptor coactivator-1.PLoS One. 2011;6(7):e21939. doi: 10.1371/journal.pone.0021939. Epub 2011 Jul 7. PLoS One. 2011. PMID: 21760925 Free PMC article.
-
Binding-folding induced regulation of AF1 transactivation domain of the glucocorticoid receptor by a cofactor that binds to its DNA binding domain.PLoS One. 2011;6(10):e25875. doi: 10.1371/journal.pone.0025875. Epub 2011 Oct 7. PLoS One. 2011. PMID: 22003412 Free PMC article.
-
Mutations of glucocorticoid receptor differentially affect AF2 domain activity in a steroid-selective manner to alter the potency and efficacy of gene induction and repression.Biochemistry. 2008 Jul 22;47(29):7648-62. doi: 10.1021/bi800472w. Epub 2008 Jun 26. Biochemistry. 2008. PMID: 18578507 Free PMC article.
-
Folding of the glucocorticoid receptor N-terminal transactivation function: dynamics and regulation.Mol Cell Endocrinol. 2012 Jan 30;348(2):450-6. doi: 10.1016/j.mce.2011.03.024. Epub 2011 Apr 8. Mol Cell Endocrinol. 2012. PMID: 21501657 Review.
-
Gene regulation by the glucocorticoid receptor: structure:function relationship.J Steroid Biochem Mol Biol. 2005 Apr;94(5):383-94. doi: 10.1016/j.jsbmb.2004.12.046. Epub 2005 Apr 22. J Steroid Biochem Mol Biol. 2005. PMID: 15876404 Review.
Cited by
-
Selective Modulation of the Human Glucocorticoid Receptor Compromises GR Chromatin Occupancy and Recruitment of p300/CBP and the Mediator Complex.Mol Cell Proteomics. 2024 Mar;23(3):100741. doi: 10.1016/j.mcpro.2024.100741. Epub 2024 Feb 20. Mol Cell Proteomics. 2024. PMID: 38387774 Free PMC article.
-
Tumor Susceptibility Gene 101 Regulates the Glucocorticoid Receptor through Disorder-Mediated Allostery.Biochemistry. 2021 Jun 1;60(21):1647-1657. doi: 10.1021/acs.biochem.1c00079. Epub 2021 May 19. Biochemistry. 2021. PMID: 34009973 Free PMC article.
-
Ensemble allosteric model: energetic frustration within the intrinsically disordered glucocorticoid receptor.Philos Trans R Soc Lond B Biol Sci. 2018 Jun 19;373(1749):20170175. doi: 10.1098/rstb.2017.0175. Philos Trans R Soc Lond B Biol Sci. 2018. PMID: 29735729 Free PMC article. Review.
-
PA1 protein, a new competitive decelerator acting at more than one step to impede glucocorticoid receptor-mediated transactivation.J Biol Chem. 2013 Jan 4;288(1):42-58. doi: 10.1074/jbc.M112.427740. Epub 2012 Nov 17. J Biol Chem. 2013. PMID: 23161582 Free PMC article.
-
Site-specific phosphorylation regulates the structure and function of an intrinsically disordered domain of the glucocorticoid receptor.Sci Rep. 2017 Nov 13;7(1):15440. doi: 10.1038/s41598-017-15549-5. Sci Rep. 2017. PMID: 29133811 Free PMC article.
References
-
- Chrousos G. P., Kino T. (2005) Intracellular glucocorticoid signaling: a formerly simple system turns stochastic. Sci. STKE 2005, pe48 - PubMed
-
- Pratt W. B., Galigniana M. D., Morishima Y., Murphy P. J. (2004) Role of molecular chaperones in steroid receptor action. Essays Biochem. 40, 41–58 - PubMed
-
- Pratt W. B. (1993) The role of heat shock proteins in regulating the function, folding, and trafficking of the glucocorticoid receptor. J. Biol. Chem. 268, 21455–21458 - PubMed
Publication types
MeSH terms
Substances
Grants and funding
LinkOut - more resources
Full Text Sources
Other Literature Sources
Miscellaneous
