. 2013 Feb;23(2):217-27.
doi: 10.1101/gr.140301.112. Epub 2012 Nov 6.

Functional genomic analysis of chromosomal aberrations in a compendium of 8000 cancer genomes

Affiliations

Functional genomic analysis of chromosomal aberrations in a compendium of 8000 cancer genomes

Tae-Min Kim et al. Genome Res. 2013 Feb.

Abstract

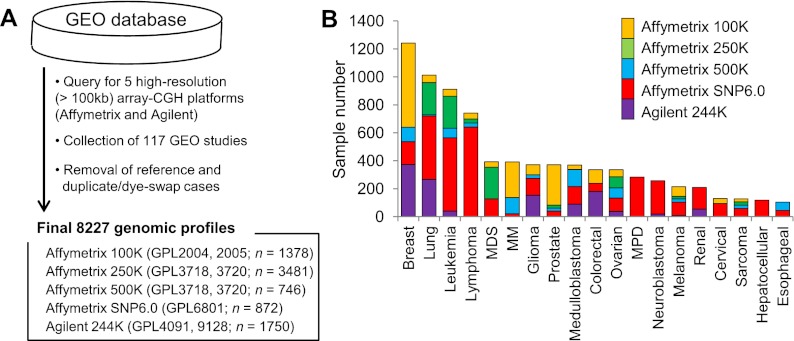
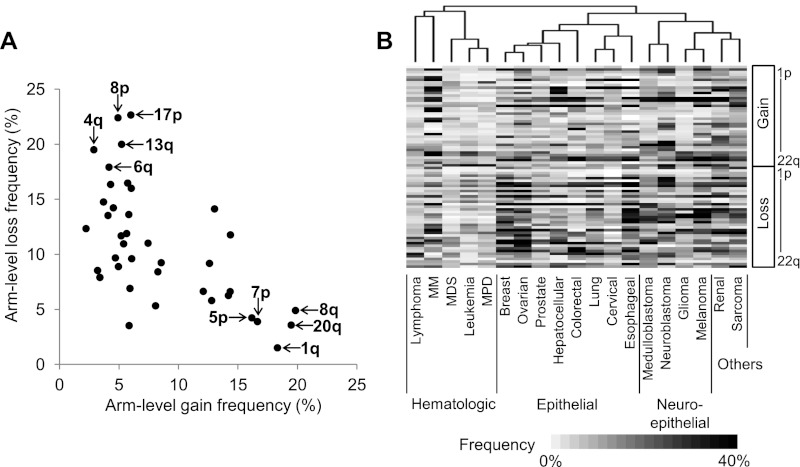
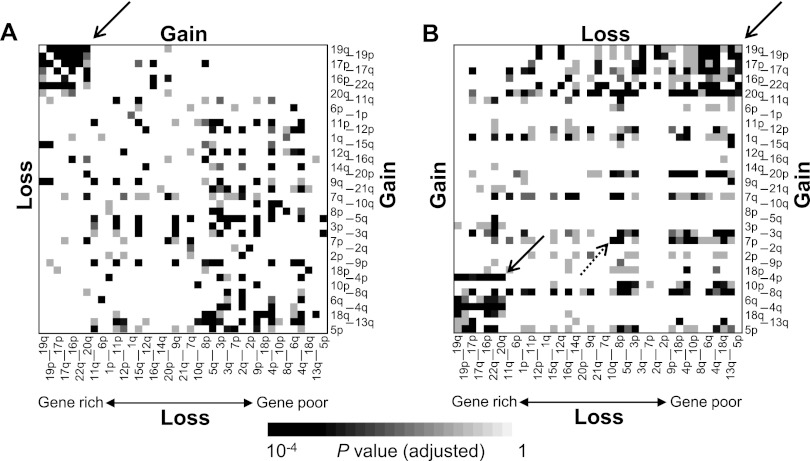
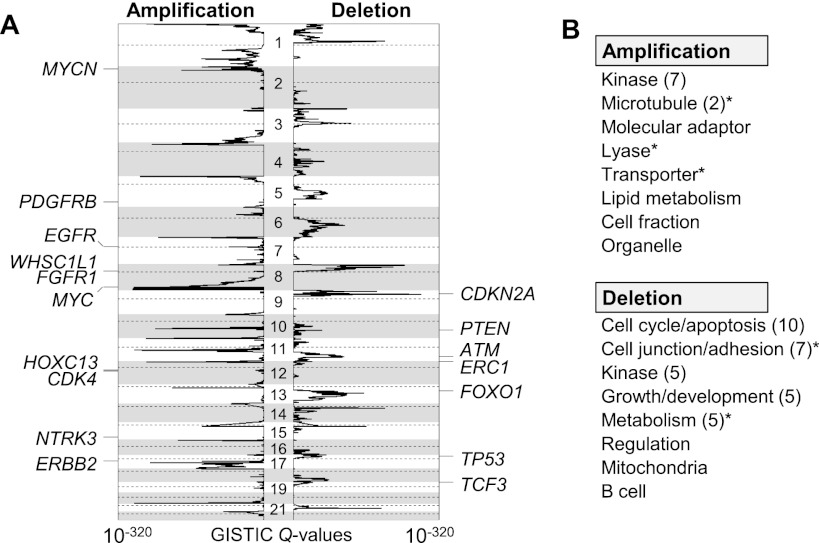
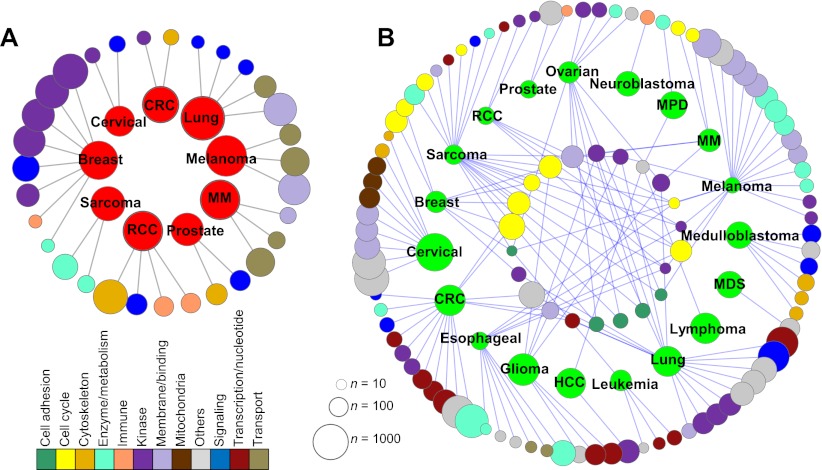
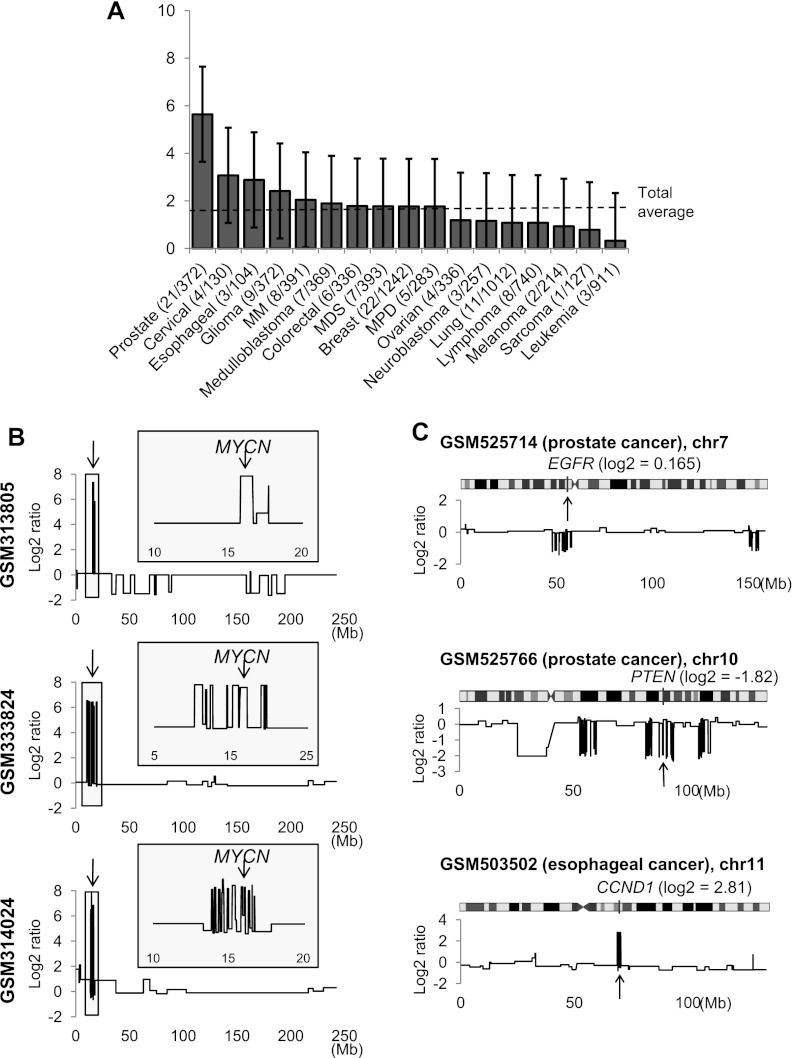
A large database of copy number profiles from cancer genomes can facilitate the identification of recurrent chromosomal alterations that often contain key cancer-related genes. It can also be used to explore low-prevalence genomic events such as chromothripsis. In this study, we report an analysis of 8227 human cancer copy number profiles obtained from 107 array comparative genomic hybridization (CGH) studies. Our analysis reveals similarity of chromosomal arm-level alterations among developmentally related tumor types as well as a number of co-occurring pairs of arm-level alterations. Recurrent ("pan-lineage") focal alterations identified across diverse tumor types show an enrichment of known cancer-related genes and genes with relevant functions in cancer-associated phenotypes (e.g., kinase and cell cycle). Tumor type-specific ("lineage-restricted") alterations and their enriched functional categories were also identified. Furthermore, we developed an algorithm for detecting regions in which the copy number oscillates rapidly between fixed levels, indicative of chromothripsis. We observed these massive genomic rearrangements in 1%-2% of the samples with variable tumor type-specific incidence rates. Taken together, our comprehensive view of copy number alterations provides a framework for understanding the functional significance of various genomic alterations in cancer genomes.


Figures

Figure 1.
Figure 1.
Compilation of large-scale cancer genome copy number profiles. (A) A schematic of data collection is shown. Five high-resolution, array-CGH platforms used are listed with the corresponding GEO accession ID (GPL) and the number of associated samples. (B) Major tumor types (>100 samples for each type) are shown with their sample numbers with respect to the five platforms. (MDS) Myelodysplastic syndrome, (MM) multiple myeloma, (MPD) myeloproliferative disorder.
Figure 2.
Figure 2.
Overview of chromosomal arm-level alteration frequency. (A) A scatter plot shows the arm-level alteration frequency measured across the entire data set (n = 8227). The top five most frequently gained or lost chromosomal arms are marked. Size-adjusted arm-level alteration frequencies are separately shown in Supplemental Figure S4. (B) Hierarchical clustering using the arm-level alteration frequency largely segregates 19 tumor types into three clusters of hematologic, epithelial, and neuroepithelial origins (from left to right). The heat map shows the frequency of chromosomal copy gains (above) and losses (below), ordered from 1p to 22q.
Figure 3.
Figure 3.
Concordant and discordant relationships between arm-level alterations. (A) The extent of concordance for chromosomal arm-level gain-gain and loss-loss is shown in the upper right and lower left triangles, respectively. The chromosomal arms are sorted by gene density (genes/Mb; e.g., 19q and 5p are the most gene-rich and gene-poor chromosomal arms, respectively). The heat map shows the multiple test-adjusted significance of concordance. The arrow marks a cluster of frequent gain-gain and loss-loss pairs between gene-rich chromosomal arms. (B) The extent of discordance between chromosomal arm-level gain-loss is shown. The two solid arrows indicate clusters of chromosomal arm pairs with frequent discordant changes between gene-rich and gene-poor chromosomal arms. The dotted arrow indicates a discordant pair between 7p gain and 10q loss.
Figure 4.
Figure 4.
Recurrent chromosomal alterations across diverse tumor types. (A) The significance of recurrent amplification (left) and deletion (right) as measured by the GISTIC algorithm (GISTIC Q value; log-scaled) is plotted across the genome. Seventeen known targets (cancer consensus genes) are shown at the corresponding peaks. (B) The GO categories significantly enriched in pan-lineage amplification and deletion MCRs are shown. Similar functional categories (e.g., “kinase” or “kinase activity”) are grouped, and the representative function is shown with the number of related GO functions in parentheses. An asterisk indicates that the corresponding functional categories remained significant after removal of MCRs with known cancer genes.
Figure 5.
Figure 5.
Functional association map of tumor type-specific alterations. (A) The genes belonging to tumor type-specific amplifications are shown as red nodes in a circular layout. (CRC) Colorectal cancer, (HCC) hepatocellular carcinoma, and (RCC) renal cell carcinoma. Significantly enriched GO categories are shown as nodes with different color schemes according to their functional annotations below. The size of each node is proportional to the number of genes in the gene set. (B) The association map of tumor type-specific deletions and their enriched GO categories is shown. GO categories associated with more than one tumor type and those with single connections are shown in and out of the cancer node circle, respectively. The full list of functional annotations and of individual GO categories and the genes responsible for the enrichment are available in Supplemental Table S5.
Figure 6.
Figure 6.
The prevalence of chromothripsis and examples of local chromothripsis involving known cancer genes. (A) The prevalence of chromothripsis measured across different tumor types is shown with 95% confidence intervals. The number of samples showing genomic evidence of chromothripsis is shown in parentheses with the total sample number associated with the tumor type. A dashed line indicates the average frequency across the entire data set. (B) Three neuroblastoma cases with evidence of chromothripsis on chromosome 2 are shown. Arrows indicate the MYCN locus, and insets show a more detailed pattern of copy number changes around the locus. (C) Three examples of local chromothripsis involving known cancer genes of EGFR, PTEN, and CCND1 loci are shown, with the log2 ratios at the cancer gene loci in parentheses.

Similar articles

Cited by

References

    1. Akavia UD, Litvin O, Kim J, Sanchez-Garcia F, Kotliar D, Causton HC, Pochanard P, Mozes E, Garraway LA, Pe’er D 2010. An integrated approach to uncover drivers of cancer. Cell 143: 1005–1017 - PMC - PubMed
    1. Albertson DG, Pinkel D 2003. Genomic microarrays in human genetic disease and cancer. Hum Mol Genet 12: R145–R152 - PubMed
    1. Albertson DG, Collins C, McCormick F, Gray JW 2003. Chromosome aberrations in solid tumors. Nat Genet 34: 369–376 - PubMed
    1. Ashburner M, Ball CA, Blake JA, Botstein D, Butler H, Cherry JM, Davis AP, Dolinski K, Dwight SS, Eppig JT, et al. 2000. Gene ontology: Tool for the unification of biology. The Gene Ontology Consortium. Nat Genet 25: 25–29 - PMC - PubMed
    1. Barrett T, Troup DB, Wilhite SE, Ledoux P, Rudnev D, Evangelista C, Kim IF, Soboleva A, Tomashevsky M, Marshall KA, et al. 2009. NCBI GEO: Archive for high-throughput functional genomic data. Nucleic Acids Res 37: D885–D890 - PMC - PubMed

Publication types

LinkOut - more resources