. 2013 Feb;23(2):323-30.
doi: 10.1101/gr.141978.112. Epub 2012 Nov 6.

Genome-scale coestimation of species and gene trees

Affiliations

Genome-scale coestimation of species and gene trees

Bastien Boussau et al. Genome Res. 2013 Feb.

Abstract

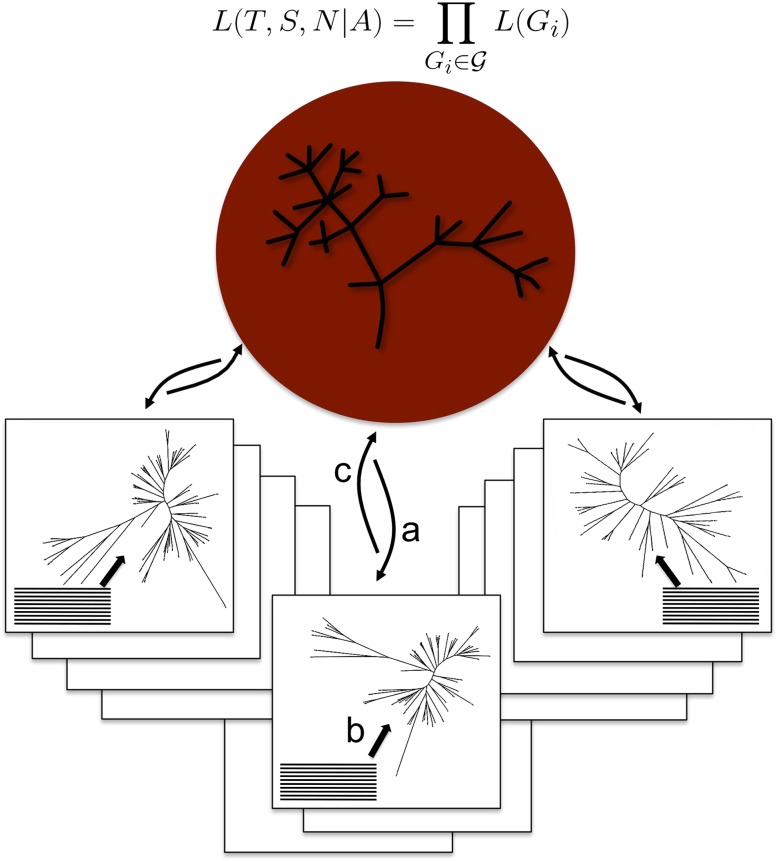
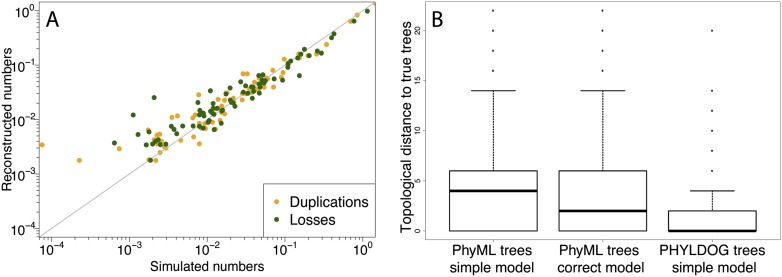
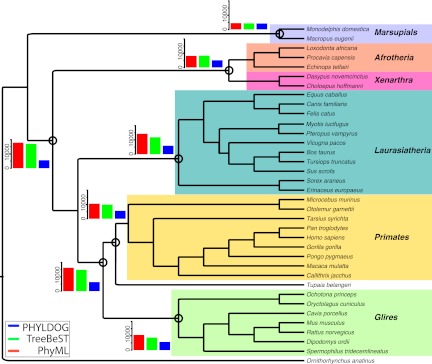
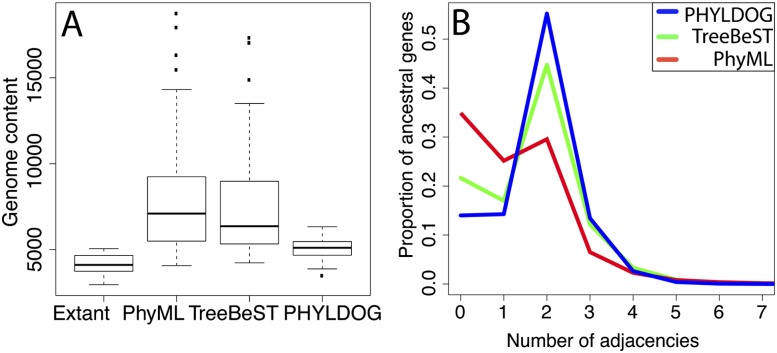
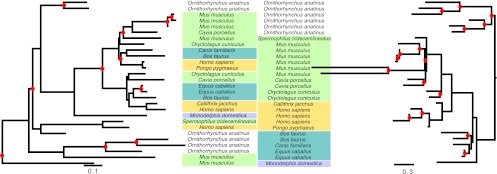
Comparisons of gene trees and species trees are key to understanding major processes of genome evolution such as gene duplication and loss. Because current methods to reconstruct phylogenies fail to model the two-way dependency between gene trees and the species tree, they often misrepresent gene and species histories. We present a new probabilistic model to jointly infer rooted species and gene trees for dozens of genomes and thousands of gene families. We use simulations to show that this method accurately infers the species tree and gene trees, is robust to misspecification of the models of sequence and gene family evolution, and provides a precise historic record of gene duplications and losses throughout genome evolution. We simultaneously reconstruct the history of mammalian species and their genes based on 36 completely sequenced genomes, and use the reconstructed gene trees to infer the gene content and organization of ancestral mammalian genomes. We show that our method yields a more accurate picture of ancestral genomes than the trees available in the authoritative database Ensembl.


Figures

Figure 1.
Figure 1.
Genome-scale joint reconstruction of the species and gene trees. PHYLDOG is using a parallel server–client architecture. The server (in red) is in charge of the species tree search, and computes L(T, S, N|A). It communicates with clients (in boxes), each one in charge of one or more gene families, for which they search the gene tree maximizing L(Gi) = L(S, N|Ti) × L(Ti|Ai), using sequence alignments. (a) The server sends the current species tree as well as other parameters to the clients. (b) The clients compute L(Ti|Ai), i.e., the likelihood of a sequence alignment given the gene tree. ( c) The clients compute L(S, N|Ti), and send L(Gi) to the server.
Figure 2.
Figure 2.
(A) Correlation between the expected and reconstructed numbers of duplications and losses per gene and per branch of the species tree. The x = y line is in gray. (B) Topological (RF) (Robinson and Foulds 1979) distance to the true gene family trees of the trees reconstructed by PHYLDOG under a simpler model of sequence evolution (JC69) than that used in the simulation (HKY85 with rate heterogeneity among sites) and by PhyML under the same simple model and under the correct model of evolution. For PHYLDOG, the median RF distance to the true tree is at 0.
Figure 3.
Figure 3.
Mammalian tree reconstructed by PHYLDOG, with arbitrary branch lengths. Ancestral gene contents obtained using PhyML (red), TreeBeST (green), and PHYLDOG (blue) are shown for several nodes (circled).
Figure 4.
Figure 4.
Quality of ancestral chromosome reconstruction inferred from gene tree reconciliations. We used the species tree and reconciliations from Compara to analyze TreeBeST trees, and the most parsimonious reconciliation using the species tree in Figure 3 for PhyML and PHYLDOG trees. (A) Genome content corresponds to the total number of genes from 5039 families (selected for comparison purposes, see Supplemental Material section S10), for all ancestral nodes in the species phylogeny. “Extant” corresponds to the observed numbers of genes in our data set for extant species. Gene contents reconstructed from PHYLDOG trees are significantly smaller than those reconstructed from TreeBeST trees: paired Wilcoxon test P-value = 4.10−4. (B) Number of adjacencies per ancestral gene. The proportion of genes with two adjacencies is higher for PHYLDOG (blue) than for PhyML (red) and TreeBeST (green) (paired Wilcoxon test P-value = 3.10−11 for the comparison with TreeBeST).
Figure 5.
Figure 5.
Reconciled trees reconstructed by TreeBeST (left) and by PHYLDOG (right) for gene family containing human gene coding for protein ENSP00000391561, “T-cell receptor, gamma, variable region V9.” Gene names have been replaced by species names (see Supplemental Fig. S11 for original gene names). Although PHYLDOG predicts more duplications (red dots) than TreeBeST, it proposes a scenario more consistent with ancestral chromosomal organizations (proportion of ancestral genes with two neighbors: TreeBeST: 0.29, PHYLDOG: 0.54).

Similar articles

Cited by

References

    1. Akerborg O, Sennblad B, Arvestad L, Lagergren J 2009. Simultaneous Bayesian gene tree reconstruction and reconciliation analysis. Proc Natl Acad Sci 106: 5714–5719 - PMC - PubMed
    1. Arvestad L 2003. Bayesian gene/species tree reconciliation and orthology analysis using MCMC. Bioinformatics 19: i7–i15 - PubMed
    1. Bansal MS, Eulenstein O 2008. The multiple gene duplication problem revisited. Bioinformatics 24: i132–i138 - PMC - PubMed
    1. Bansal MS, Burleigh JG, Eulenstein O 2010. Efficient genome-scale phylogenetic analysis under the duplication-loss and deep coalescence cost models. BMC Bioinformatics 11: S42 - PMC - PubMed
    1. Chaudhary R, Bansal M, Wehe A, Fernandez-Baca D, Eulenstein O 2010. igtp: A software package for large-scale gene tree parsimony analysis. BMC Bioinformatics 11: 574. - PMC - PubMed

Publication types