. 2012 Nov 20;109(47):19462-7.
doi: 10.1073/pnas.1214107109. Epub 2012 Nov 6.

Neuronal code for extended time in the hippocampus

Affiliations

Neuronal code for extended time in the hippocampus

Emily A Mankin et al. Proc Natl Acad Sci U S A. .

Erratum in

Abstract

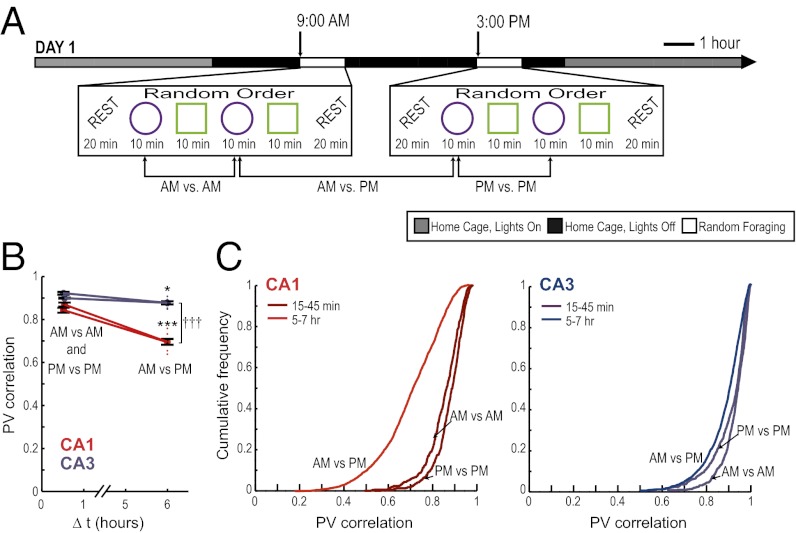
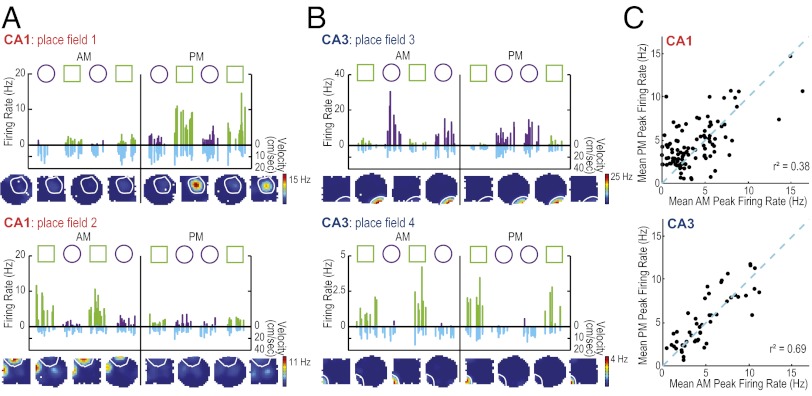
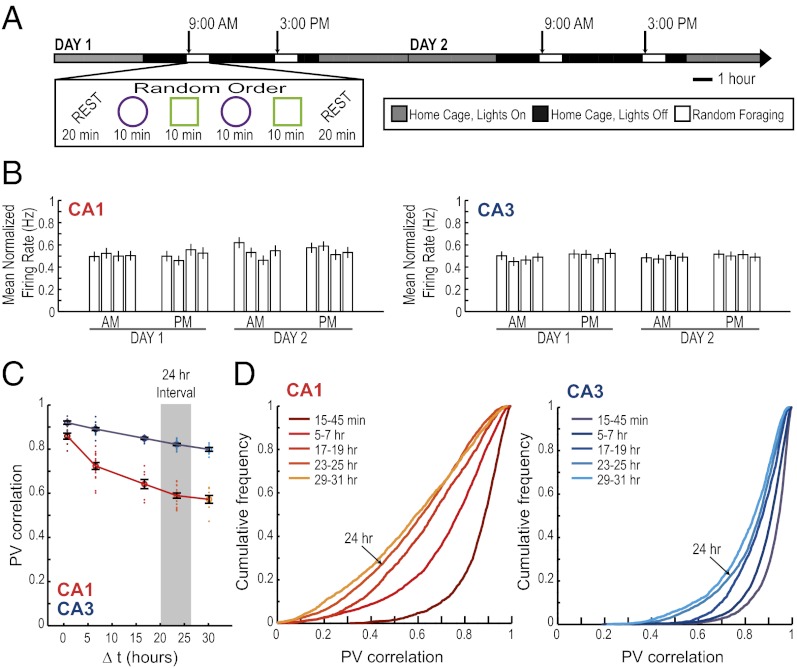
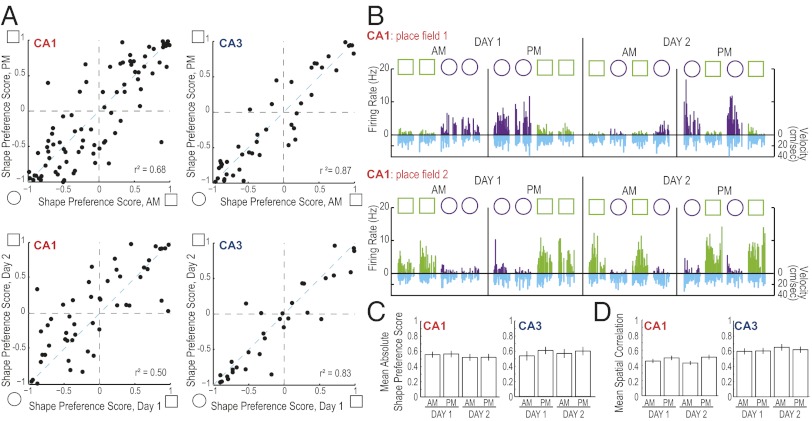
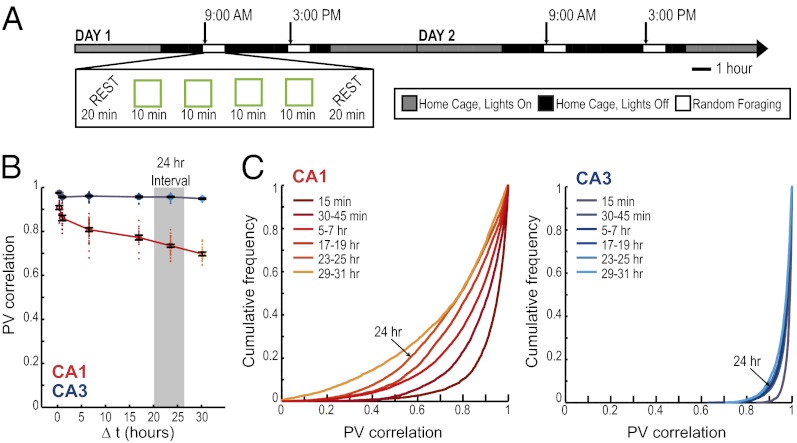
The time when an event occurs can become part of autobiographical memories. In brain structures that support such memories, a neural code should exist that represents when or how long ago events occurred. Here we describe a neuronal coding mechanism in hippocampus that can be used to represent the recency of an experience over intervals of hours to days. When the same event is repeated after such time periods, the activity patterns of hippocampal CA1 cell populations progressively differ with increasing temporal distances. Coding for space and context is nonetheless preserved. Compared with CA1, the firing patterns of hippocampal CA3 cell populations are highly reproducible, irrespective of the time interval, and thus provide a stable memory code over time. Therefore, the neuronal activity patterns in CA1 but not CA3 include a code that can be used to distinguish between time intervals on an extended scale, consistent with behavioral studies showing that the CA1 area is selectively required for temporal coding over such periods.


Conflict of interest statement

The authors declare no conflict of interest.

Figures

Fig. 1.
Fig. 1.
Decorrelated neuronal firing patterns between morning and afternoon sessions in hippocampal cell populations. (A) Behavioral design and experimental timeline. A series of four random-foraging sessions was conducted in the morning (AM), and a second series of four sessions was conducted in the afternoon (PM). Each series consisted of a random sequence of two sessions in a square and of two sessions in a circular enclosure. The enclosure was placed in the same location within the room, and extramaze cues remained constant. Recordings began after 9–26 d of pretraining in this paradigm. (B) The firing patterns of simultaneously recorded CA1 and CA3 neuronal populations were compared across repetitions of the same enclosure shape (as illustrated for circle comparisons in A). A PV represents the firing rates of all active cells within a 5 × 5 cm pixel in the spatial map. The activity patterns of an active cell population were compared between sessions by calculating the correlation coefficients of PVs from corresponding pixels between two sessions and by taking the average over all pixels. The values for pair-wise comparisons at short time intervals (within AM or within PM) and at long time intervals (AM vs. PM) were grouped. Each of the comparisons is shown as a red or blue dot, and black error bars report the mean ± SEM of between-session comparisons at each time interval. CA1 cell populations (red) showed a decreased correlation between sessions that occurred at 6-h intervals compared with sessions within <1 h. PVs of CA3 cells (blue) also showed a small degree of decorrelation between time intervals, but the degree of decorrelation was substantially lower in CA3 compared with CA1. (C) Cumulative distribution functions for PV correlations between pairs of recordings in the same enclosure shape at different time intervals. *P < 0.05; ***P < 0.001 for comparisons between time intervals; †††P < 0.001 for comparisons between CA1 and CA3; see text for statistics.
Fig. 2.
Fig. 2.
CA1 place fields show variability in firing rate between morning and afternoon sessions. (A) Firing rates for two representative CA1 place fields and (B) for two CA3 place fields. Fields 2, 3, and 4 were recorded simultaneously. Each 10-min recording session throughout the AM and PM is shown. Symbols above each graph indicate the order of enclosure shapes. Each bar (green for the square shape and purple for the circular shape) represents the firing rate of the cell during a pass of the animal through the place field (see Fig. S6 for methods and Fig. S7 for additional examples). For each pass, the corresponding running speed of the animal is plotted downward below the x-axis (cm/s, in blue). The variability in firing rates cannot be explained by movement velocity or by the proximity of the path to the field center (Fig. S8). For each firing field the corresponding color-coded rate maps (averaged across each 10-min recording session) are shown below the line graph. The color scale for rate maps is from 0 Hz (blue) to the peak rate of the day (red). Coding differences emerged, in part, from CA1 place fields that changed or became silent at a subset of time points. In all cases in which cells became silent, it was verified in preceding or subsequent rest sessions that spikes from these cells could be detected (Fig. S1). (C) For each place field, mean peak rates within each enclosure shape were calculated in the morning and in the afternoon. These rates were compared within each hippocampal subregion. Place fields that were not active (mean peak rate <2 Hz) at either time point were excluded. For active cells, the firing rates between AM and PM were more variable in CA1 compared with CA3 (see text for statistics; SI Materials and Methods).
Fig. 3.
Fig. 3.
The decorrelation in CA1 network activity over extended time periods does not repeat cyclically across days. (A) To determine whether differences in CA1 network activity patterns can be explained as a circadian effect, we extended the hippocampal recordings across 2 d. (B) The mean ± SEM normalized firing rate for all active CA1 (Left) and CA3 (Right) principal neurons is shown for each 10-min recording session across the 2-d experiment. For each cell, the normalized firing rate was calculated by dividing the average firing rate for each session by that cell’s maximum average firing rate in any of the sessions. A circadian variation in firing rate was not observed (see text for statistics). (C) PV correlations between pairs of recordings in the same enclosure shape are shown as dots. Every pair-wise comparison is aligned to its time interval, so that, for example, the AM/PM comparisons on day 1 and the AM/PM comparisons on day 2 are all aligned to the 6-h interval (see Fig. S9 for the complete pair-wise correlation matrix). The black error bars report the mean ± SEM for pair-wise comparisons at each time interval. The correlation coefficients for the CA1 population activity (red) decreased monotonically as a function of elapsed time between recording sessions up to at least 30 h (see text for statistics and Fig. S2 for comparisons of up to 60 h). Repeated CA1 recordings at matching times of day on two consecutive days (24-h interval) show a smaller correlation than recordings at shorter intervals but at different times of the day (P < 0.001 for the post hoc comparison). Thus, the effect we observed is not due to circadian fluctuations. (D) Cumulative distribution functions for PV correlations between pairs of recordings in the same enclosure shape at different time intervals.
Fig. 4.
Fig. 4.
Differences in firing patterns over extended time periods did not preclude the encoding of spatial information or of contextual differences. (A) For each place field a shape preference score was calculated as a measure of the difference in firing rates between the circular and the square enclosure (scores of −1 or +1 indicate that the cell fired only in the circle or only in the square, respectively). This score was compared between recording blocks (Left, CA1; Right, CA3) in the AM and PM (Upper) and between days (Lower). For calculating each day’s score, all AM and PM recording sessions within a day are used. Individual CA1 fields show more variable shape coding over 6-h intervals and over 1-d intervals than individual CA3 fields [F(82, 43) = 2.51 and F(50, 31) = 2.55, P < 0.01 for comparisons of shape preference scores at both time intervals]. (B) Firing rates within two representative CA1 place fields from the same cell over 2 d (data presented as described in Fig. 2; see Fig. S10 for additional examples). The CA1 place fields showed a change in the degree of discrimination between the square and circular enclosure between time points (Fig. 2A). Field 1 normally fired at its highest rate in the circular shape, but became silent in the AM session on day 2. The field resumed its firing in the circular enclosure during the PM session on day 2. It was therefore observed that shape preferences could be lost and regained between blocks of sessions at different time points. (C and D) Even though individual CA1 cells show coding differences between time points, the average degree of context and place coding is consistent within CA1 and within CA3 cell populations (see text for statistics).
Fig. 5.
Fig. 5.
When testing with a single enclosure shape, firing patterns of the CA3 network remained highly consistent for repetitions of the same environment over extended time intervals, whereas activity patterns in the CA1 network changed. (A) An experimental design with a single enclosure shape was used to test whether the decorrelation of hippocampal activity patterns could have been an effect of intervening experiences in a different context (Fig. 3). The mean PV correlation between pairs of recordings in the same enclosure shape (B) and the corresponding cumulative distribution function for the PVs (C) are shown as described in Fig. 3. Highly consistent firing patterns in the CA3 population were observed over time intervals of 30 min to 30 h. In contrast, the CA1 network continued to show a pronounced monotonic decrease in firing similarity with time (see text for statistics).

References

    1. Tulving E. Episodic and semantic memory. In: Tulving E, Donaldson W, editors. Organization of Memory. New York: Academic; 1972. pp. 381–403.
    1. Tulving E. Elements of Episodic Memory. Oxford: Clarendon; 1983.
    1. Friedman WJ. Memory for the time of past events. Psychol Bull. 1993;113(1):44–66.
    1. O’Keefe J, Burgess N, Donnett JG, Jeffery KJ, Maguire EA. Place cells, navigational accuracy, and the human hippocampus. Philos Trans R Soc Lond B Biol Sci. 1998;353(1373):1333–1340. - PMC - PubMed
    1. Zola-Morgan S, Squire LR. Neuroanatomy of memory. Annu Rev Neurosci. 1993;16:547–563. - PubMed

Publication types