. 2012 Nov 20;109(47):19166-71.
doi: 10.1073/pnas.1211132109. Epub 2012 Nov 6.

Ion-beam irradiation, gene identification, and marker-assisted breeding in the development of low-cadmium rice

Affiliations

Ion-beam irradiation, gene identification, and marker-assisted breeding in the development of low-cadmium rice

Satoru Ishikawa et al. Proc Natl Acad Sci U S A. .

Erratum in

Abstract

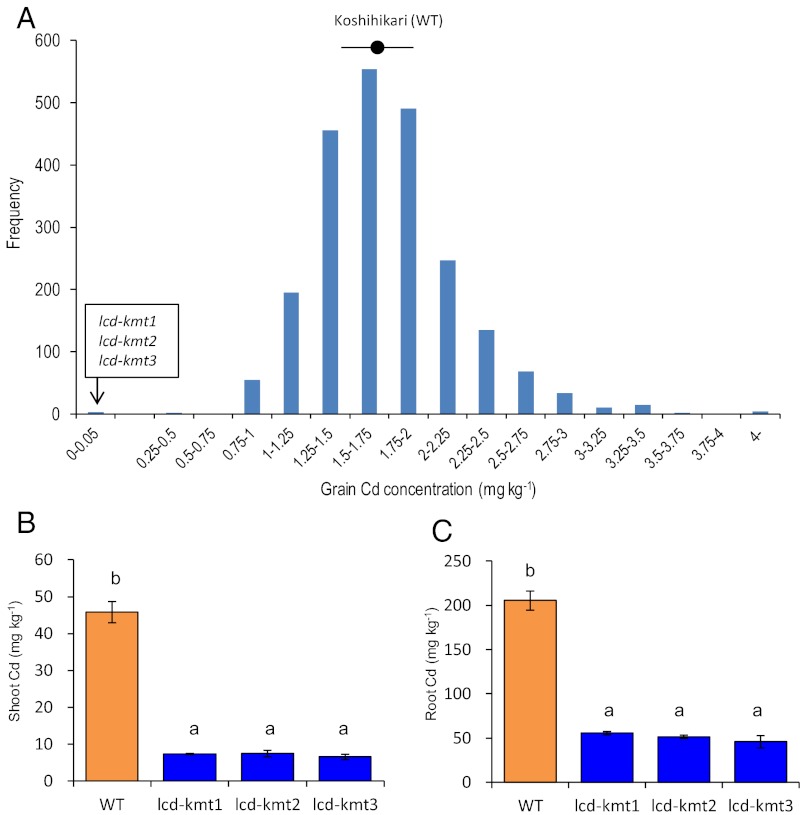
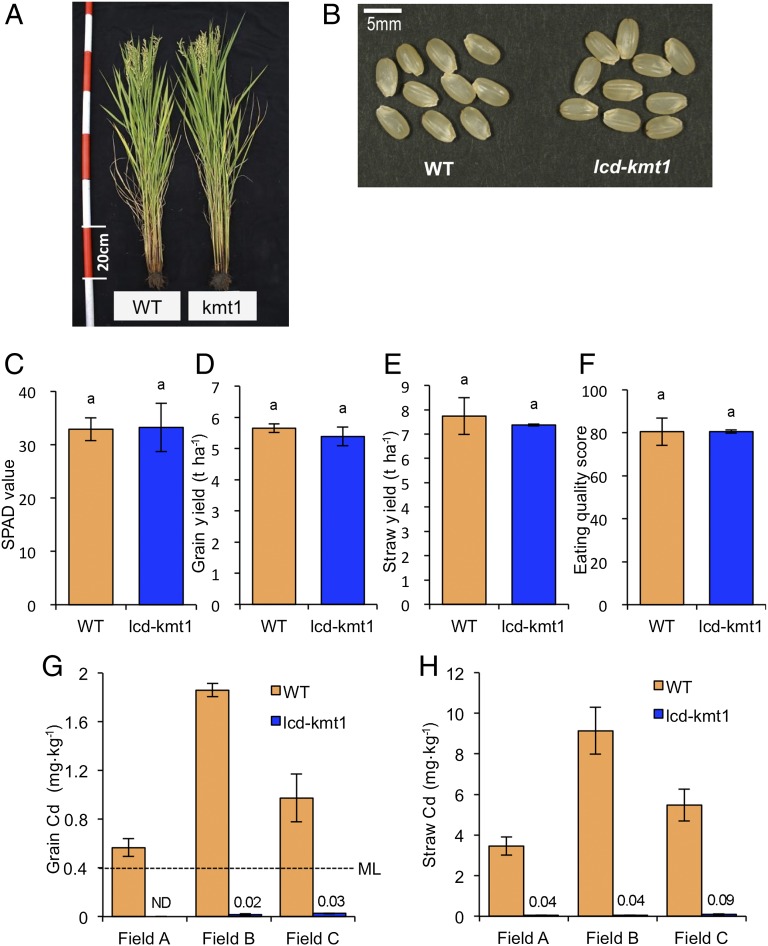
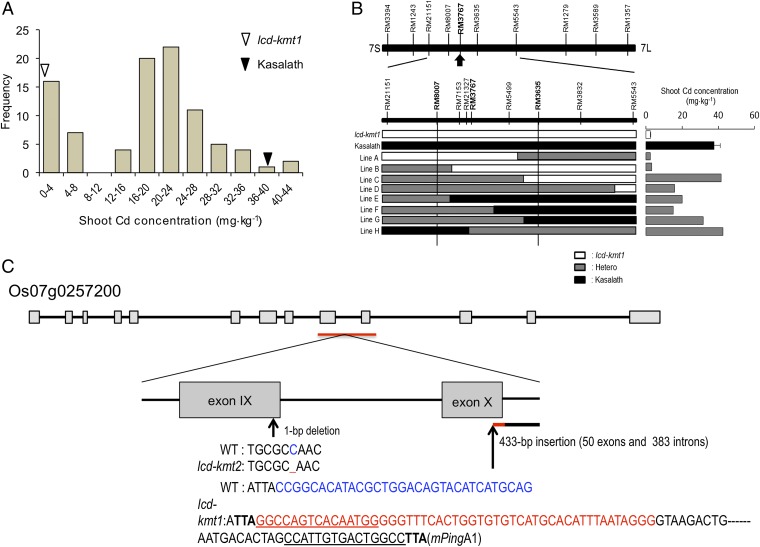
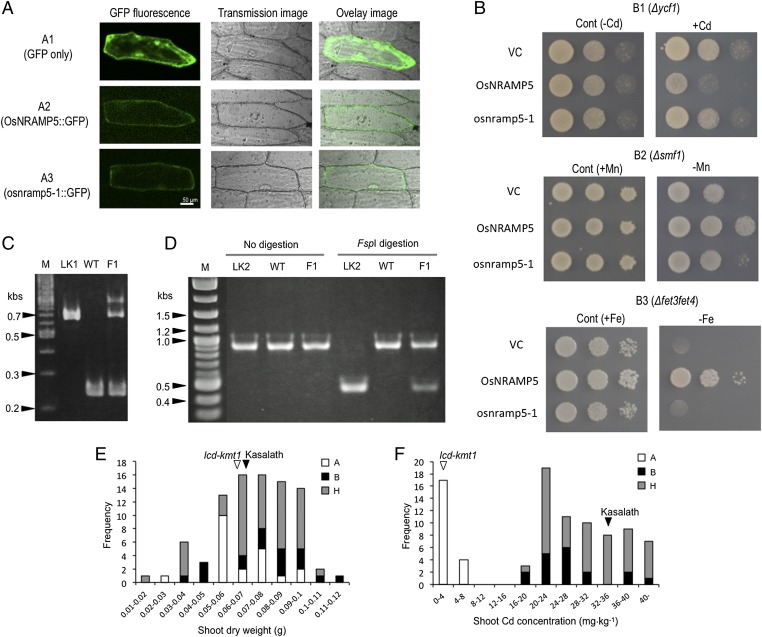
Rice (Oryza sativa L.) grain is a major dietary source of cadmium (Cd), which is toxic to humans, but no practical technique exists to substantially reduce Cd contamination. Carbon ion-beam irradiation produced three rice mutants with <0.05 mg Cd⋅kg(-1) in the grain compared with a mean of 1.73 mg Cd⋅kg(-1) in the parent, Koshihikari. We identified the gene responsible for reduced Cd uptake and developed a strategy for marker-assisted selection of low-Cd cultivars. Sequence analysis revealed that these mutants have different mutations of the same gene (OsNRAMP5), which encodes a natural resistance-associated macrophage protein. Functional analysis revealed that the defective transporter protein encoded by the mutant osnramp5 greatly decreases Cd uptake by roots, resulting in decreased Cd in the straw and grain. In addition, we developed DNA markers to facilitate marker-assisted selection of cultivars carrying osnramp5. When grown in Cd-contaminated paddy fields, the mutants have nearly undetectable Cd in their grains and exhibit no agriculturally or economically adverse traits. Because mutants produced by ion-beam radiation are not transgenic plants, they are likely to be accepted by consumers and thus represent a practical choice for rice production worldwide.


Conflict of interest statement

The authors declare no conflict of interest.

Figures

Fig. 1.
Fig. 1.
(A) Frequency distribution of grain Cd concentration in rice mutants (2,592 M2 plants) grown in pots filled with Cd-contaminated soil. The circle and range bar represent the mean and SD of grain Cd concentration in Koshihikari (288 plants). (B and C) Cd concentrations in the shoots and roots of WT Koshihikari and of three low-Cd Koshihikari mutants (lcd-kmt1, lcd-kmt2, and lcd-kmt3) grown in hydroponic culture containing 0.18 µM Cd. Bars labeled with different letters differ significantly (P < 0.05, ANOVA followed by Tukey's test).
Fig. 2.
Fig. 2.
Agronomic traits of Koshihikari and lcd-kmt mutants grown in the field. (A) Plant morphologies of WT Koshihikari and lcd-kmt1. (B) Morphologies of unpolished rice grains. (C) Chlorophyll content in the flag leaf determined using a SPAD meter. (D) Grain yield. (E) Straw yield. (F) Eating quality scores evaluated using a taste analyzer; values >80 are considered “good quality.” No significant differences in agronomic traits or eating quality were observed between the WT and lcd-kmt1 (P > 0.05, ANOVA followed by Tukey's test). (G and H) Cd concentration of unpolished rice (G) and straw (H). Plants were grown in Cd-polluted paddy fields in three regions of Japan. Data are presented as means ± SD (n = 5). ND, not detected; ML, maximum allowed Cd concentration for rice (Codex Alimentarius Commission).
Fig. 3.
Fig. 3.
Positional cloning of the gene. (A) Frequency distribution for shoot Cd concentration of 92 F2 seedlings derived from a cross between lcd-kmt1 and WT Kasalath, an indica cultivar. White and black triangles represent the mean shoot Cd concentration of lcd-kmt1 and Kasalath, respectively. (B) Gene locus for low shoot Cd concentration on chromosome 7. Arrow indicates the peak logarithm of odds for the putative QTL gene. Graphical genotypes of F2 plants having recombination in the candidate region (Left) and their shoot Cd concentrations (Right) are shown. White, black, and gray bars indicate regions homozygous for the lcd-kmt1 allele, homozygous for the Kasalath allele, and heterozygous for the two alleles, respectively. (C) Structure of OsNRAMP5 (Os07g0257200) and the mutation sites in lcd-kmt1 and lcd-kmt2. Exons and introns are indicated by gray bars and black lines, respectively. The arrow below exon IX indicates the position of a 1-bp deletion in lcd-kmt2 relative to the corresponding sequence in WT Koshihikari. The arrow below exon X indicates the position of a 433-bp insertion in lcd-kmt1. The blue WT nucleotides have been replaced by the red nucleotides in lcd-kmt1. The bold TTA sequences indicate 3-bp target-site duplications, and underlines indicate 15-bp terminal inverted repeats.
Fig. 4.
Fig. 4.
(A) Subcellular localization of OsNRAMP5 and osnramp5-1 in transformed onion epidermal cells. (A, 1) GFP only; (A, 2) OsNRAMP5::GFP fusion protein; (A, 3) osnamp5-1::GFP fusion protein. (B) Growth of yeast cells transformed with the vector control (VC), OsNRAMP5, or osnramp5-1. Yeasts were spotted at three dilutions (optical densities at 600 nm of 0.1, 0.01, and 0.001, left to right). (B, 1) Growth of yeast Δycf1 (Cd-sensitive mutant) cells; (B, 2) growth of Δsmf1 (Mn-uptake mutant) yeast cells; (B, 3) growth of Δfet3fet4 (Fe-uptake mutant) yeast cells. Cont, control, with (+) or without (−) the specified metal. (C and D) DNA fragments of the genomic region containing the mutation amplified by PCR. (C) M, size marker; LK1, lcd-kmt1; WT, wild-type Koshihikari; F1, F1 progeny of lcd-kmt1 × Koshihikari. (D) M, size marker; LK2, lcd-kmt2; WT, wild-type Koshihikari; F1, F1 progeny of lcd-kmt2 × Koshihikari. Where indicated, amplified samples were digested with FspI before electrophoresis. (E) Frequency distribution for shoot dry weight of F2 plants derived from a cross between lcd-kmt1 and Kasalath. Using the developed marker (C), the 88 F2 plants were classified into three genotype classes: (A) those homozygous for the osnramp5-1 allele of lcd-kmt1, (B) those homozygous for the OsNRAMP5 allele of Kasalath, and (H) those that were heterozygous for the two alleles. (F) Frequency distribution for shoot Cd concentrations of F2 plants used in E.

References

    1. European Food Safety Authority Scientific opinion on tolerable weekly intake for cadmium. EFSA J. 2011;9(2):1975.
    1. Tsuchiya K. Epidemiological studies on cadmium in the environment in Japan: Etiology of itai-itai disease. Fed Proc. 1976;35(12):2412–2418. - PubMed
    1. Food and Agriculture Organization/World Health Organization (2010) Joint FAO/WHO Expert Committee on Food Additives, Seventy-Third Meeting, Geneva, 8–17 June 2010. Summary and Conclusions. Available at: www.who.int/foodsafety/publications/chem/summary73.pdf. Accessed June 30, 2012.
    1. Codex Alimentarius (2008) CODEX STAN 193-1995, Codex general standard for contaminants and toxins in foods and feed. Available at: www.codexalimentarius.net/download/standards/17/CXS_193e.pdf. Accessed June 30, 2012.
    1. International Rice Research Institute (2011). World Production and Consumption of Domestic Milled Rice. Available at: http://ricestat.irri.org/vis/wrs_quickCharts.php. Accessed June 30, 2012.

Publication types

MeSH terms