

The effect of bacterial recombination on adaptation on fitness landscapes with limited peak accessibility
- PMID: 23133344
- PMCID: PMC3487459
- DOI: 10.1371/journal.pcbi.1002735
The effect of bacterial recombination on adaptation on fitness landscapes with limited peak accessibility
Abstract
There is ample empirical evidence revealing that fitness landscapes are often complex: the fitness effect of a newly arisen mutation can depend strongly on the allelic state at other loci. However, little is known about the effects of recombination on adaptation on such fitness landscapes. Here, we investigate how recombination influences the rate of adaptation on a special type of complex fitness landscapes. On these landscapes, the mutational trajectories from the least to the most fit genotype are interrupted by genotypes with low relative fitness. We study the dynamics of adapting populations on landscapes with different compositions and numbers of low fitness genotypes, with and without recombination. Our results of the deterministic model (assuming an infinite population size) show that recombination generally decelerates adaptation on these landscapes. However, in finite populations, this deceleration is outweighed by the accelerating Fisher-Muller effect under certain conditions. We conclude that recombination has complex effects on adaptation that are highly dependent on the particular fitness landscape, population size and recombination rate.
Conflict of interest statement
The authors have declared that no competing interests exist.
Figures
 .
.
 ), B) positive baseline epistasis (
 ), C) negative baseline epistasis (
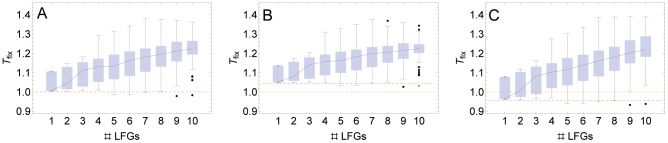
 ). Each box shows the distribution of Tfix across all fitness landscapes with the respective number of LFGs. The boxes give the interquartile range. Outliers are represented with the points in more than 1.5 times the interquartile range from the end of the boxes. The whiskers are extended to the farthest points from the end of the boxes that are not outliers. The black line connects the median of the boxes. The red dashed lines show Tfix on the landscape with no LFG with the corresponding baseline epistasis. In the absence of baseline epistasis and LFGs in the fitness landscape, recombination has no effect on the rate of adaptation (Tfix
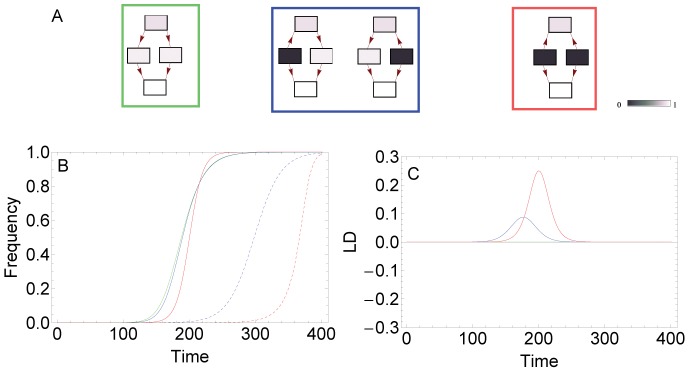
 , orange dashed lines). Parameters take the values
  .
.
 values of 0.95, 1.0 and 1.05, respectively. C) Effect of mutation rate. Red, orange and green curves correspond to
  values of 10−6, 10−5 and 10−4, respectively. D) Effect of selection coefficient. Orange, red and green curves correspond to
  values of 0.050, 0.075 and 0.1, respectively. Note the different scales of the y-axes in plots A to D.
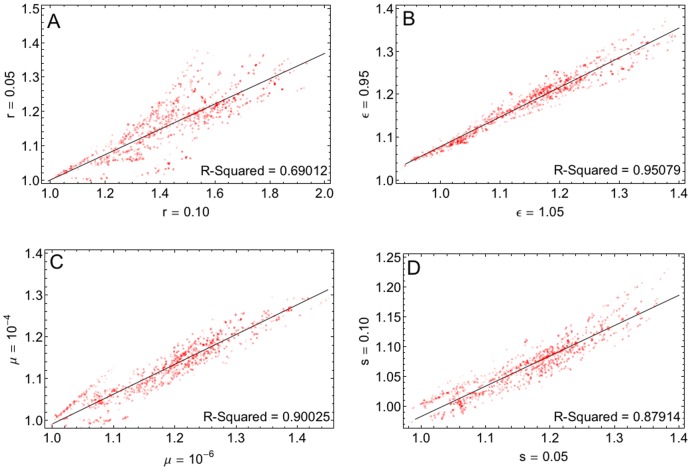
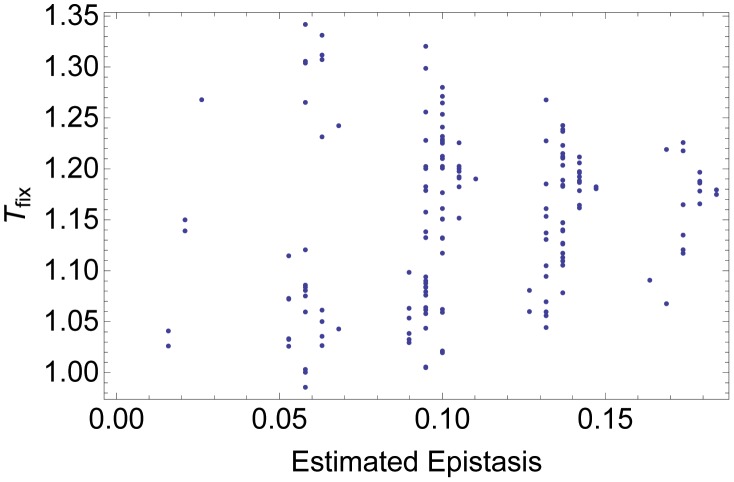
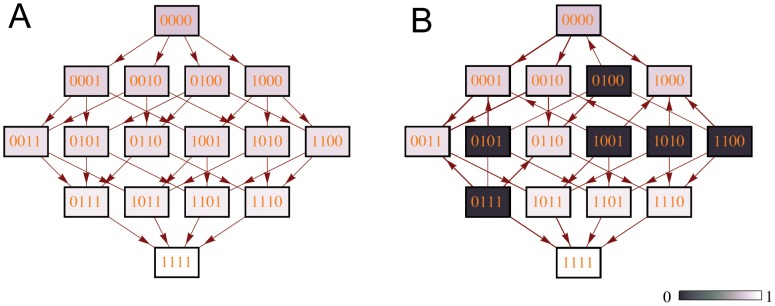
 . See main text for a description of how we measured physiological epistasis on these fitness landscapes.
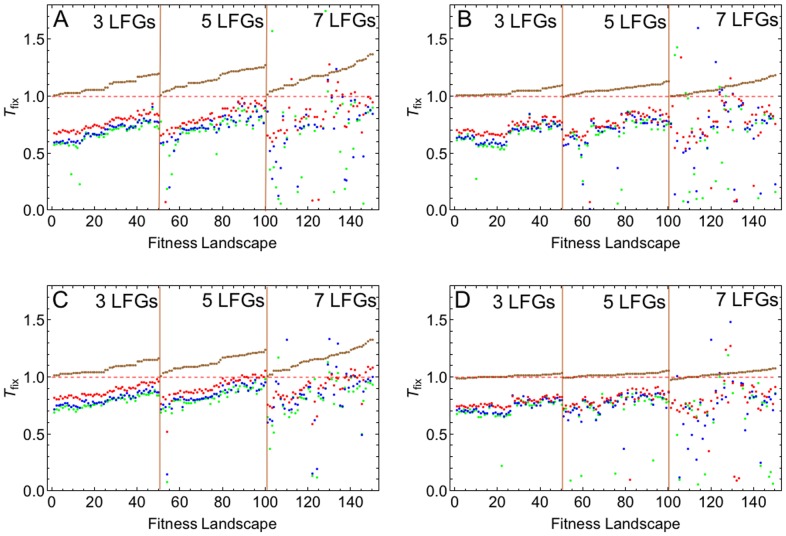
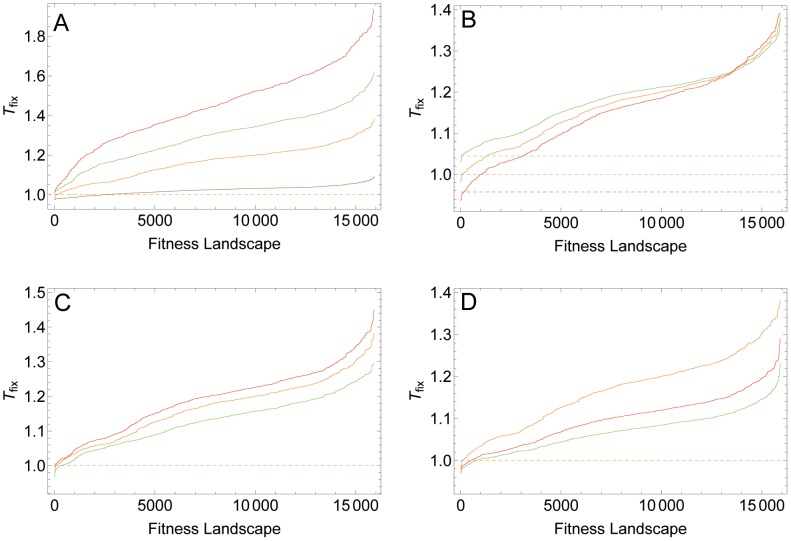
 (red),
  (blue) and
  (green). All Tfix values are sorted according to their recombination effect in the deterministic model (brown). Parameters take standard values (see also Figures 4 and 5), and in plots B to D we varies one of the parameters: A) Standard parameter set, B)
  , C)
, C)  and D)
  .
.References
-
- Otto SP, Lenormand T (2002) Resolving the paradox of sex and recombination. Nature Rev Genet 3: 252–261. - PubMed
-
- Michod RE, Levin BR (1987) The Evolution of Sex: An Examination of Current Ideas. Michigan: Sinauer Associates. 352 p.
-
- Weinreich DM, Watson RA, Chao L (2005) Perspective: Sign epistasis and genetic constraint on evolutionary trajectories. Evolution 59: 1165–1174. - PubMed
-
- Eshel I, Feldman MW (1970) On the evolutionary effect of recombination. Theor Popul Biol 1: 88–100. - PubMed
-
- Kondrashov AS (1988) Deleterious mutations and the evolution of sexual reproduction. Nature 336: 435–440. - PubMed
Publication types
MeSH terms
LinkOut - more resources
Full Text Sources
