

Modeling protective anti-tumor immunity via preventative cancer vaccines using a hybrid agent-based and delay differential equation approach
- PMID: 23133347
- PMCID: PMC3486888
- DOI: 10.1371/journal.pcbi.1002742
Modeling protective anti-tumor immunity via preventative cancer vaccines using a hybrid agent-based and delay differential equation approach
Abstract
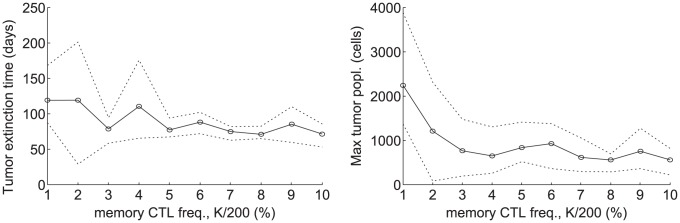
A next generation approach to cancer envisions developing preventative vaccinations to stimulate a person's immune cells, particularly cytotoxic T lymphocytes (CTLs), to eliminate incipient tumors before clinical detection. The purpose of our study is to quantitatively assess whether such an approach would be feasible, and if so, how many anti-cancer CTLs would have to be primed against tumor antigen to provide significant protection. To understand the relevant dynamics, we develop a two-compartment model of tumor-immune interactions at the tumor site and the draining lymph node. We model interactions at the tumor site using an agent-based model (ABM) and dynamics in the lymph node using a system of delay differential equations (DDEs). We combine the models into a hybrid ABM-DDE system and investigate dynamics over a wide range of parameters, including cell proliferation rates, tumor antigenicity, CTL recruitment times, and initial memory CTL populations. Our results indicate that an anti-cancer memory CTL pool of 3% or less can successfully eradicate a tumor population over a wide range of model parameters, implying that a vaccination approach is feasible. In addition, sensitivity analysis of our model reveals conditions that will result in rapid tumor destruction, oscillation, and polynomial rather than exponential decline in the tumor population due to tumor geometry.
Conflict of interest statement
The authors have declared that no competing interests exist.
Figures
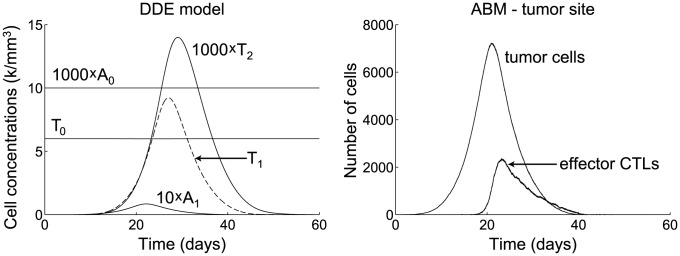
 , immature APCs in the periphery;
  , mature APCs in the lymph node;
  memory CTLs in the lymph node;
  , effector CTLs in the lymph node; and
  , effector CTLs in the periphery. (right) Plot of tumor cell and CTL populations at tumor site.
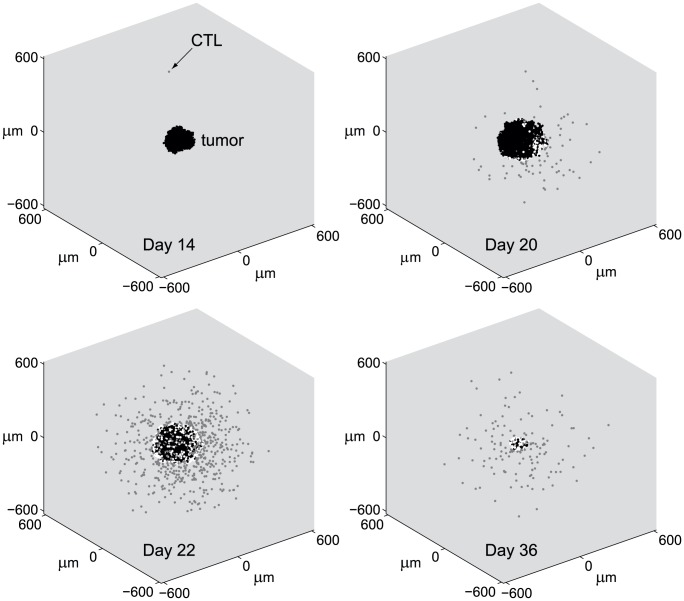
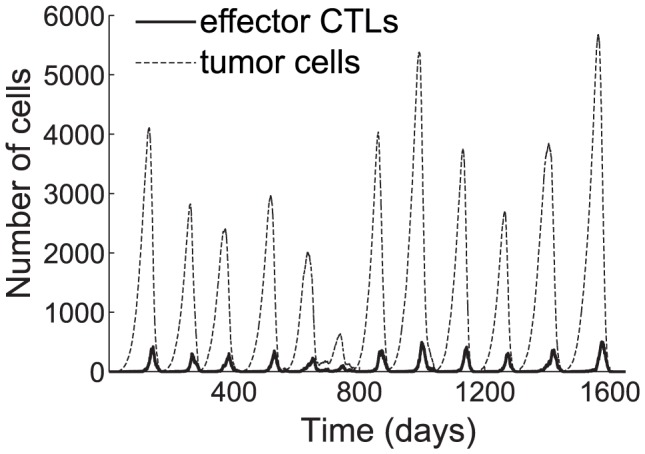
 , is 24 h. All other parameters are taken from the base values shown in Table 1. The tumor population peaks and declines 12 times. Low points of tumor remissions range from 1 to 105 residual cells. The tumor is eliminated on day 1,600.
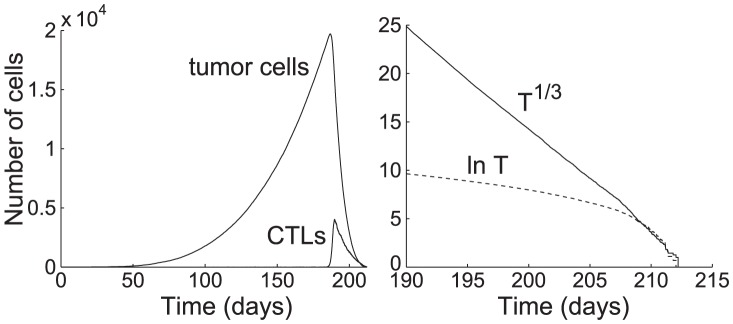
 . All other parameters are taken from the base values shown in Table 1. The tumor population is extinct on day 213. (right) Plot of the cube root and natural logarithm of the tumor population from day 190 to extinction. The numerical solution of
  has a high linear correlation
  , implying that
  decays as a cubic function of
  . (The linear regression is
  .) On the other hand, the numerical solution of
  does not exhibit linear behavior, showing that
  does not decay exponentially.
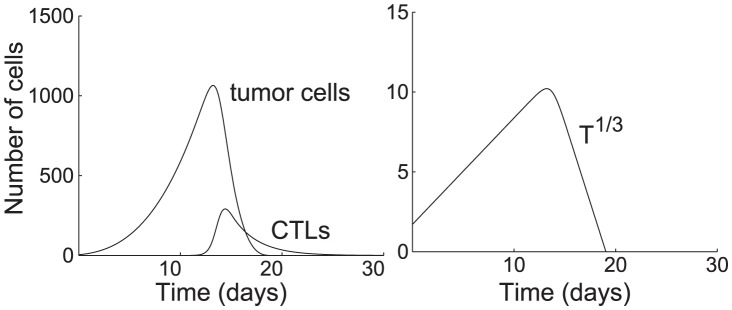
 ,
,  , and
, and  . All other parameters are taken from the base values in Table 1. The tumor population is extinct, i.e., identically 0, on day 19.04. (right) Time plot of the cube root of the tumor population. The final decline appears nearly linear.
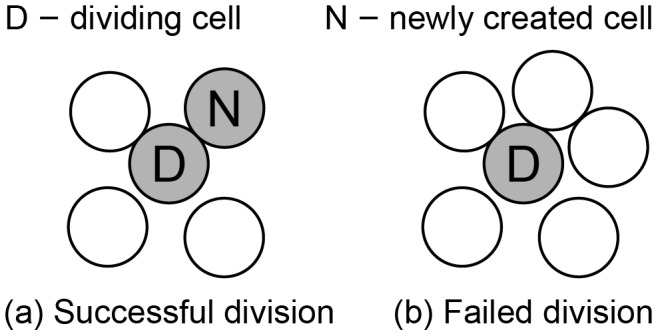
 . To simplify diagrams, figures are shown in 2-D, although the model occurs in 3-D.
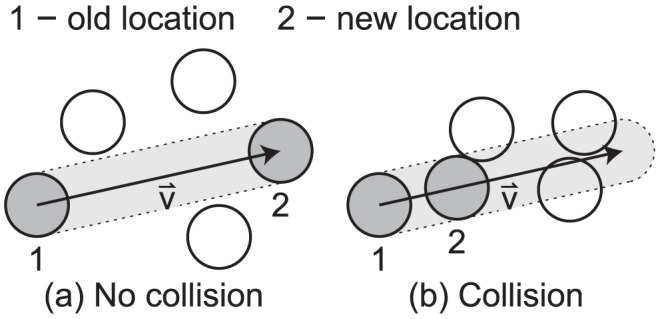
 , (b) Collision – the CTL moves as far as possible without colliding with another cell.
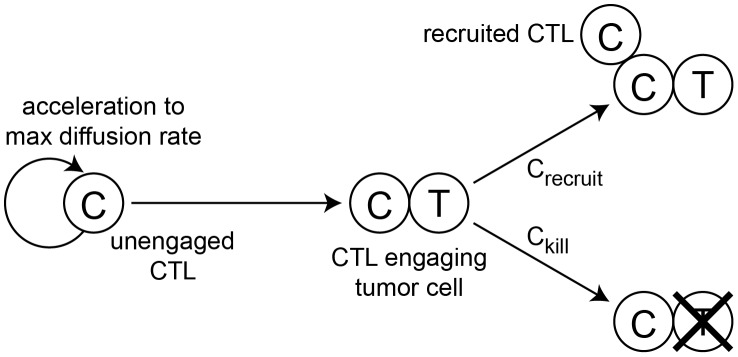
 or kill the cancer cell with probability
  . When the cancer cell dies, the CTL disengages and accelerates up to the maximum rate. Although not shown, all CTLs may die with probability
  .
.
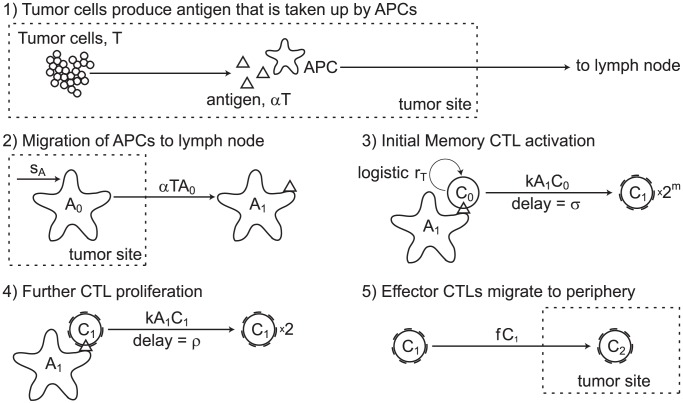
 divisions. (4) Effector CTLs that have completed the division program continue to divide upon further interaction with mature, antigen-bearing APCs. (5) Effector CTLs continually migrate to the periphery. Although not indicated, each cell in the diagram also has a natural death rate.
Similar articles
-
An in silico model of cytotoxic T-lymphocyte activation in the lymph node following short peptide vaccination.J R Soc Interface. 2018 Mar;15(140):20180041. doi: 10.1098/rsif.2018.0041. J R Soc Interface. 2018. PMID: 29540543 Free PMC article.
-
An indispensable role of type-1 IFNs for inducing CTL-mediated complete eradication of established tumor tissue by CpG-liposome co-encapsulated with model tumor antigen.Int Immunol. 2006 Mar;18(3):425-34. doi: 10.1093/intimm/dxh381. Epub 2006 Jan 13. Int Immunol. 2006. PMID: 16415100
-
A model of the effects of cancer cell motility and cellular adhesion properties on tumour-immune dynamics.Math Med Biol. 2017 Jun 1;34(2):215-240. doi: 10.1093/imammb/dqw004. Math Med Biol. 2017. PMID: 27094601
-
Human tumour antigens recognized by T cells: new perspectives for anti-cancer vaccines?Mol Med Today. 1997 Jun;3(6):261-8. doi: 10.1016/S1357-4310(97)01049-6. Mol Med Today. 1997. PMID: 9211417 Review.
-
Tumor resistance to CD8+ T cell-based therapeutic vaccination.Arch Immunol Ther Exp (Warsz). 2007 Jul-Aug;55(4):205-17. doi: 10.1007/s00005-007-0029-3. Epub 2007 Jul 23. Arch Immunol Ther Exp (Warsz). 2007. PMID: 17659376 Review.
Cited by
-
Frequency-dependent selection of neoantigens fosters tumor immune escape and predicts immunotherapy response.Commun Biol. 2024 Jun 25;7(1):770. doi: 10.1038/s42003-024-06460-7. Commun Biol. 2024. PMID: 38918569 Free PMC article.
-
Model-based genotype-phenotype mapping used to investigate gene signatures of immune sensitivity and resistance in melanoma micrometastasis.Sci Rep. 2016 Apr 26;6:24967. doi: 10.1038/srep24967. Sci Rep. 2016. PMID: 27113331 Free PMC article.
-
CD8(+) T cell response to adenovirus vaccination and subsequent suppression of tumor growth: modeling, simulation and analysis.BMC Syst Biol. 2015 Jun 6;9:27. doi: 10.1186/s12918-015-0168-9. BMC Syst Biol. 2015. PMID: 26048402 Free PMC article.
-
An in silico exploration of combining Interleukin-12 with Oxaliplatin to treat liver-metastatic colorectal cancer.BMC Cancer. 2020 Jan 8;20(1):26. doi: 10.1186/s12885-019-6500-9. BMC Cancer. 2020. PMID: 31914948 Free PMC article.
-
Different ODE models of tumor growth can deliver similar results.BMC Cancer. 2020 Mar 17;20(1):226. doi: 10.1186/s12885-020-6703-0. BMC Cancer. 2020. PMID: 32183732 Free PMC article.
References
-
- Soiffer R, Hodi FS, Haluska F, Jung K, Gillessen S, et al. (2003) Vaccination with irradiated, autologous melanoma cells engineered to secrete granulocyte-macrophage colony-stimulating factor by adenoviral-mediated gene transfer augments antitumor immunity in patients with metastatic melanoma. J Clin Oncol 21: 3343–3350. - PubMed
-
- Soiffer R, Lynch T, Mihm M, Jung K, Rhuda C, et al. (1998) Vaccination with irradiated autologous melanoma cells engineered to secrete human granulocyte-macrophage colony-stimulating factor generates potent antitumor immunity in patients with metastatic melanoma. Proc Natl Acad Sci USA 95: 13141–13146. - PMC - PubMed
-
- Wang W, Epler J, Salazar LG, Riddell SR (2006) Recognition of breast cancer cells by CD8+cytotoxic T-cell clones specific for NY-BR-1. Cancer Res 66: 6826–6833. - PubMed
Publication types
MeSH terms
Substances
LinkOut - more resources
Full Text Sources
