

Emergence of the mitochondrial reticulum from fission and fusion dynamics
- PMID: 23133350
- PMCID: PMC3486901
- DOI: 10.1371/journal.pcbi.1002745
Emergence of the mitochondrial reticulum from fission and fusion dynamics
Abstract
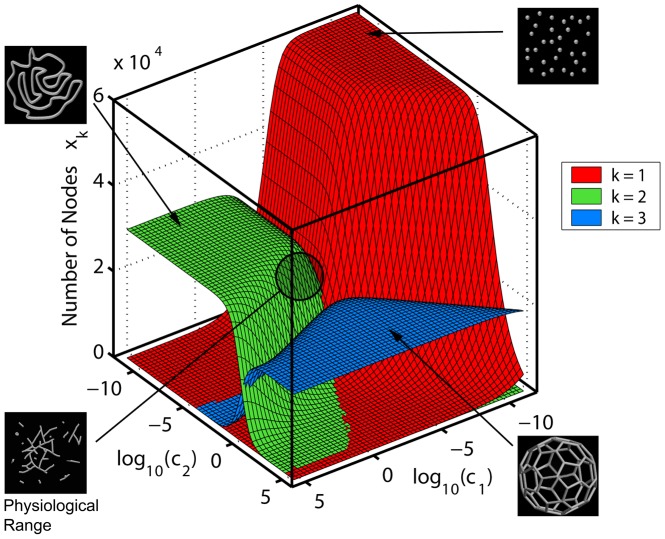
Mitochondria form a dynamic tubular reticulum within eukaryotic cells. Currently, quantitative understanding of its morphological characteristics is largely absent, despite major progress in deciphering the molecular fission and fusion machineries shaping its structure. Here we address the principles of formation and the large-scale organization of the cell-wide network of mitochondria. On the basis of experimentally determined structural features we establish the tip-to-tip and tip-to-side fission and fusion events as dominant reactions in the motility of this organelle. Subsequently, we introduce a graph-based model of the chondriome able to encompass its inherent variability in a single framework. Using both mean-field deterministic and explicit stochastic mathematical methods we establish a relationship between the chondriome structural network characteristics and underlying kinetic rate parameters. The computational analysis indicates that mitochondrial networks exhibit a percolation threshold. Intrinsic morphological instability of the mitochondrial reticulum resulting from its vicinity to the percolation transition is proposed as a novel mechanism that can be utilized by cells for optimizing their functional competence via dynamic remodeling of the chondriome. The detailed size distribution of the network components predicted by the dynamic graph representation introduces a relationship between chondriome characteristics and cell function. It forms a basis for understanding the architecture of mitochondria as a cell-wide but inhomogeneous organelle. Analysis of the reticulum adaptive configuration offers a direct clarification for its impact on numerous physiological processes strongly dependent on mitochondrial dynamics and organization, such as efficiency of cellular metabolism, tissue differentiation and aging.
Conflict of interest statement
The authors have declared that no competing interests exist.
Figures

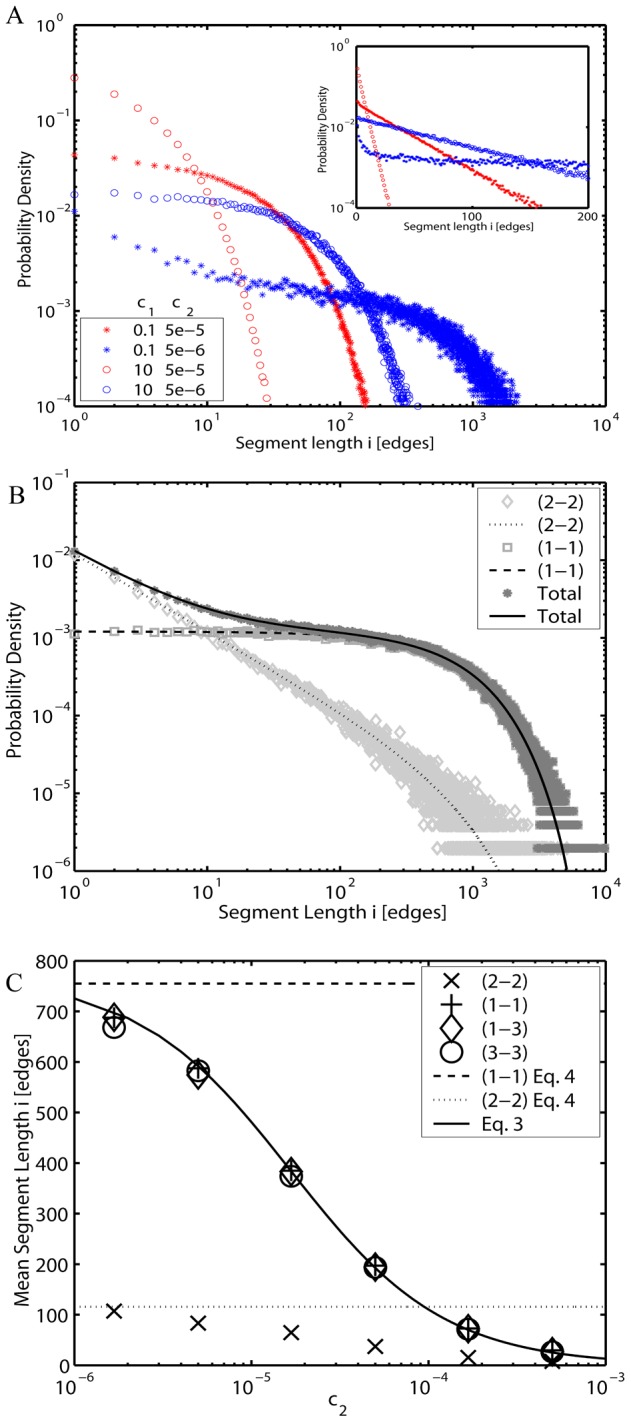
 from the deterministic model. Dotted and dashed lines: Limiting values at c
2 = 0 (Eq. 5) for sizes of loops (2-2) and open-ended (1-1) segments respectively.
from the deterministic model. Dotted and dashed lines: Limiting values at c
2 = 0 (Eq. 5) for sizes of loops (2-2) and open-ended (1-1) segments respectively.

Similar articles
-
Structural Heterogeneity of Mitochondria Induced by the Microtubule Cytoskeleton.Sci Rep. 2015 Sep 10;5:13924. doi: 10.1038/srep13924. Sci Rep. 2015. PMID: 26355039 Free PMC article.
-
Mitochondrial Fission and Fusion Dynamics Generate Efficient, Robust, and Evenly Distributed Network Topologies in Budding Yeast Cells.Cell Syst. 2020 Mar 25;10(3):287-297.e5. doi: 10.1016/j.cels.2020.02.002. Epub 2020 Feb 26. Cell Syst. 2020. PMID: 32105618
-
Elastocapillary Instability in Mitochondrial Fission.Phys Rev Lett. 2015 Aug 21;115(8):088102. doi: 10.1103/PhysRevLett.115.088102. Epub 2015 Aug 20. Phys Rev Lett. 2015. PMID: 26340213
-
Mitochondria: A worthwhile object for ultrastructural qualitative characterization and quantification of cells at physiological and pathophysiological states using conventional transmission electron microscopy.Acta Histochem. 2020 Dec;122(8):151646. doi: 10.1016/j.acthis.2020.151646. Epub 2020 Oct 28. Acta Histochem. 2020. PMID: 33128989 Review.
-
Recent advances into the understanding of mitochondrial fission.Biochim Biophys Acta. 2013 Jan;1833(1):150-61. doi: 10.1016/j.bbamcr.2012.05.002. Epub 2012 May 10. Biochim Biophys Acta. 2013. PMID: 22580041 Review.
Cited by
-
Mitochondrial redox and pH signaling occurs in axonal and synaptic organelle clusters.Sci Rep. 2016 Mar 22;6:23251. doi: 10.1038/srep23251. Sci Rep. 2016. PMID: 27000952 Free PMC article.
-
Paclitaxel-induced increase in mitochondrial volume mediates dysregulation of intracellular Ca2+ in putative nociceptive glabrous skin neurons from the rat.Cell Calcium. 2017 Mar;62:16-28. doi: 10.1016/j.ceca.2017.01.005. Epub 2017 Jan 16. Cell Calcium. 2017. PMID: 28109678 Free PMC article.
-
Network analysis of Arabidopsis mitochondrial dynamics reveals a resolved tradeoff between physical distribution and social connectivity.Cell Syst. 2021 May 19;12(5):419-431.e4. doi: 10.1016/j.cels.2021.04.006. Epub 2021 May 10. Cell Syst. 2021. PMID: 34015261 Free PMC article.
-
Mathematical Modeling of p53 Pathways.Int J Mol Sci. 2019 Oct 18;20(20):5179. doi: 10.3390/ijms20205179. Int J Mol Sci. 2019. PMID: 31635420 Free PMC article. Review.
-
Mutated FANCA Gene Role in the Modulation of Energy Metabolism and Mitochondrial Dynamics in Head and Neck Squamous Cell Carcinoma.Cells. 2022 Jul 30;11(15):2353. doi: 10.3390/cells11152353. Cells. 2022. PMID: 35954197 Free PMC article.
References
-
- Scheckhuber CQ, Erjavec N, Tinazli A, Hamann A, Nyström T, et al. (2007) Reducing mitochondrial fission results in increased life span and fitness of two fungal ageing models. Nat Cell Biol 9: 99–105. - PubMed
-
- Weber TA, Reichert AS (2010) Impaired quality control of mitochondria: Aging from a new perspective. Exp Gerontol 45: 503–511. - PubMed
-
- Ong S-B, Subrayan S, Lim SY, Yellon DM, Davidson SM, et al. (2010) Inhibiting Mitochondrial Fission Protects the Heart Against Ischemia/Reperfusion Injury. Circulation 121: 2012–2022. - PubMed
Publication types
MeSH terms
LinkOut - more resources
Full Text Sources
