

Integrating cellular metabolism into a multiscale whole-body model
- PMID: 23133351
- PMCID: PMC3486908
- DOI: 10.1371/journal.pcbi.1002750
Integrating cellular metabolism into a multiscale whole-body model
Abstract
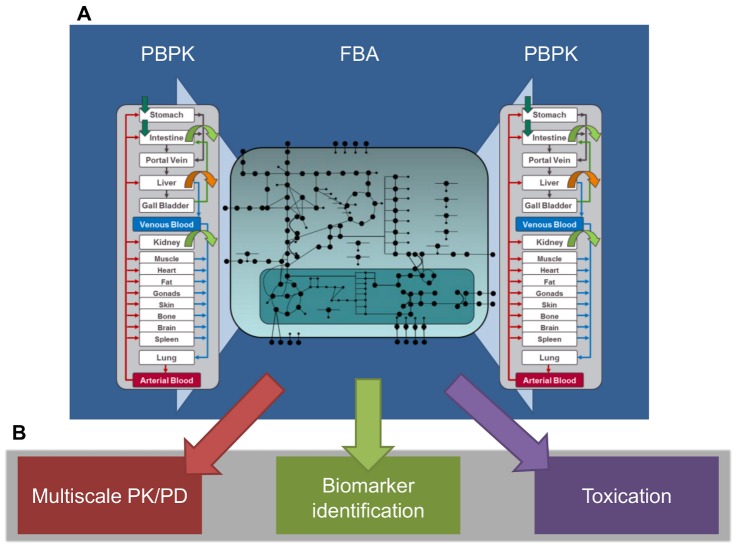
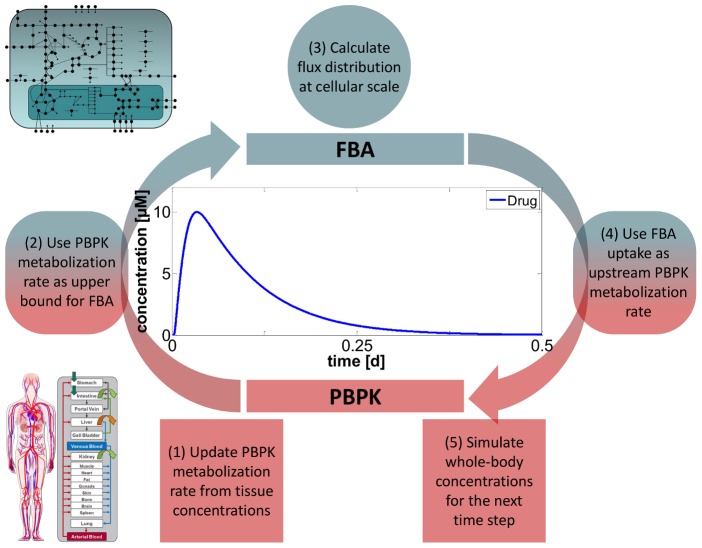
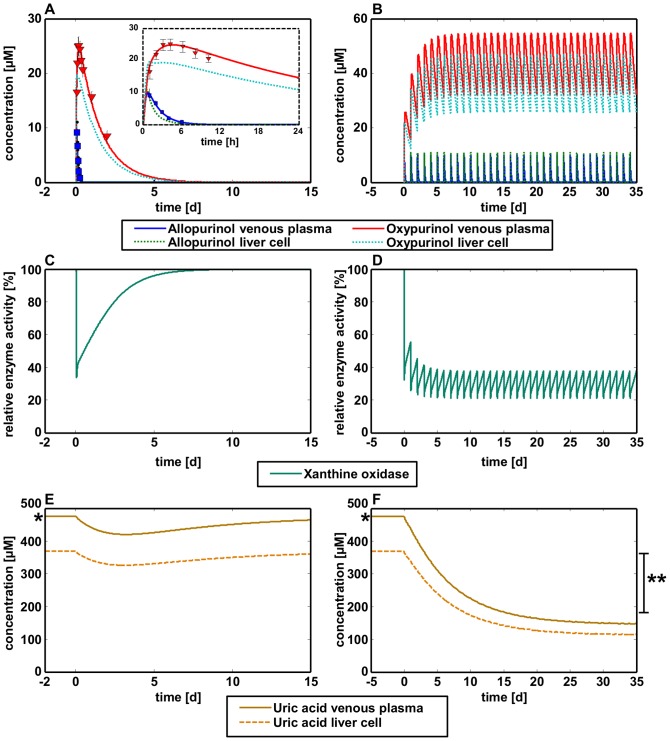
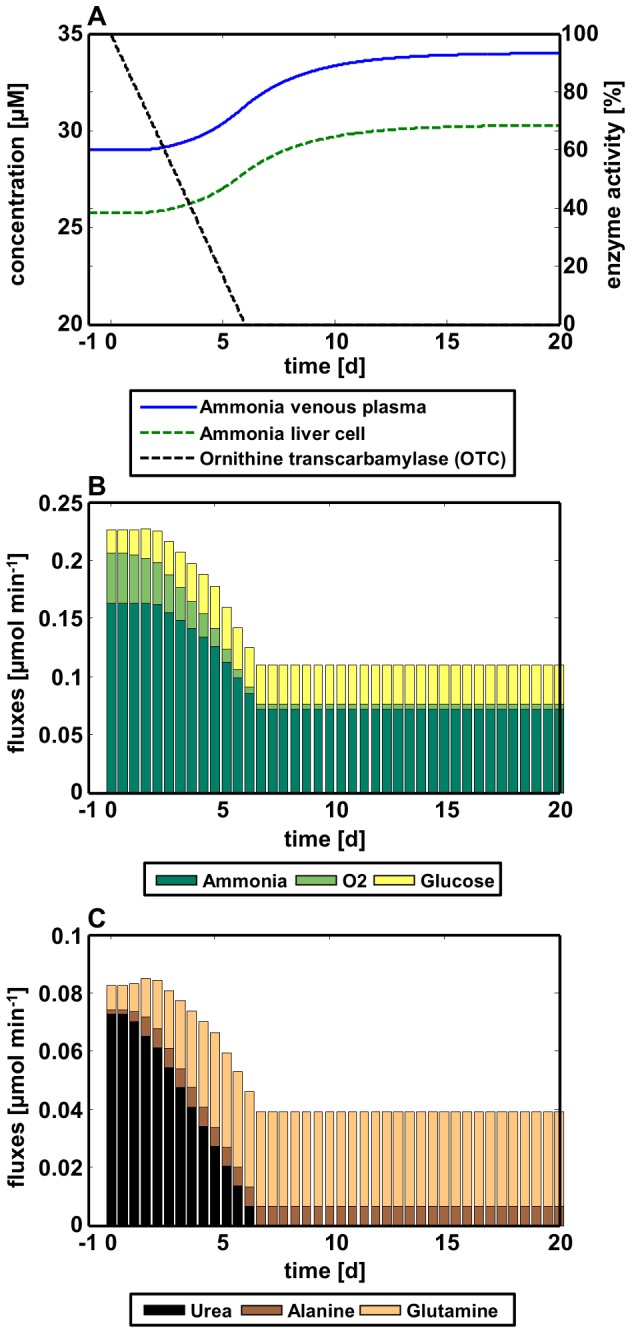
Cellular metabolism continuously processes an enormous range of external compounds into endogenous metabolites and is as such a key element in human physiology. The multifaceted physiological role of the metabolic network fulfilling the catalytic conversions can only be fully understood from a whole-body perspective where the causal interplay of the metabolic states of individual cells, the surrounding tissue and the whole organism are simultaneously considered. We here present an approach relying on dynamic flux balance analysis that allows the integration of metabolic networks at the cellular scale into standardized physiologically-based pharmacokinetic models at the whole-body level. To evaluate our approach we integrated a genome-scale network reconstruction of a human hepatocyte into the liver tissue of a physiologically-based pharmacokinetic model of a human adult. The resulting multiscale model was used to investigate hyperuricemia therapy, ammonia detoxification and paracetamol-induced toxication at a systems level. The specific models simultaneously integrate multiple layers of biological organization and offer mechanistic insights into pathology and medication. The approach presented may in future support a mechanistic understanding in diagnostics and drug development.
Conflict of interest statement
MK, SS, JL, and LK are employees of Bayer Technology Services GmbH, the company developing PK-Sim® and MoBi®.
Figures
Similar articles
-
Optimality in the zonation of ammonia detoxification in rodent liver.Arch Toxicol. 2015 Nov;89(11):2069-78. doi: 10.1007/s00204-015-1596-4. Epub 2015 Oct 5. Arch Toxicol. 2015. PMID: 26438405
-
Metabolic flux analysis of hepatocyte function in hormone- and amino acid-supplemented plasma.Metab Eng. 2003 Jan;5(1):1-15. doi: 10.1016/s1096-7176(02)00011-3. Metab Eng. 2003. PMID: 12749840
-
A mechanobiological mathematical model of liver metabolism.Biotechnol Bioeng. 2020 Sep;117(9):2861-2874. doi: 10.1002/bit.27451. Epub 2020 Jun 30. Biotechnol Bioeng. 2020. PMID: 32501531
-
Sandwich-Cultured Hepatocytes as a Tool to Study Drug Disposition and Drug-Induced Liver Injury.J Pharm Sci. 2016 Feb;105(2):443-459. doi: 10.1016/j.xphs.2015.11.008. J Pharm Sci. 2016. PMID: 26869411 Free PMC article. Review.
-
Computational Modeling of Human Metabolism and Its Application to Systems Biomedicine.Methods Mol Biol. 2016;1386:253-81. doi: 10.1007/978-1-4939-3283-2_12. Methods Mol Biol. 2016. PMID: 26677187 Review.
Cited by
-
Applied Concepts in PBPK Modeling: How to Build a PBPK/PD Model.CPT Pharmacometrics Syst Pharmacol. 2016 Oct;5(10):516-531. doi: 10.1002/psp4.12134. Epub 2016 Oct 19. CPT Pharmacometrics Syst Pharmacol. 2016. PMID: 27653238 Free PMC article.
-
Systemic Immunometabolism: Challenges and Opportunities.Immunity. 2020 Sep 15;53(3):496-509. doi: 10.1016/j.immuni.2020.08.012. Immunity. 2020. PMID: 32937151 Free PMC article. Review.
-
Metabolic network modeling of microbial communities.Wiley Interdiscip Rev Syst Biol Med. 2015 Sep-Oct;7(5):317-34. doi: 10.1002/wsbm.1308. Epub 2015 Jun 24. Wiley Interdiscip Rev Syst Biol Med. 2015. PMID: 26109480 Free PMC article. Review.
-
Personalized whole-body models integrate metabolism, physiology, and the gut microbiome.Mol Syst Biol. 2020 May;16(5):e8982. doi: 10.15252/msb.20198982. Mol Syst Biol. 2020. PMID: 32463598 Free PMC article.
-
Integration of Placental Transfer in a Fetal-Maternal Physiologically Based Pharmacokinetic Model to Characterize Acetaminophen Exposure and Metabolic Clearance in the Fetus.Clin Pharmacokinet. 2020 Jul;59(7):911-925. doi: 10.1007/s40262-020-00861-7. Clin Pharmacokinet. 2020. PMID: 32052378 Free PMC article.
References
-
- Allen J, Davey HM, Broadhurst D, Heald JK, Rowland JJ, et al. (2003) High-throughput classification of yeast mutants for functional genomics using metabolic footprinting. Nat Biotechnol 21: 692–696. - PubMed
-
- Lanpher B, Brunetti-Pierri N, Lee B (2006) Inborn errors of metabolism: the flux from Mendelian to complex diseases. Nat Rev Genet 7: 449–460. - PubMed
Publication types
MeSH terms
Substances
LinkOut - more resources
Full Text Sources
