

Disease prevention versus data privacy: using landcover maps to inform spatial epidemic models
- PMID: 23133352
- PMCID: PMC3486837
- DOI: 10.1371/journal.pcbi.1002723
Disease prevention versus data privacy: using landcover maps to inform spatial epidemic models
Abstract
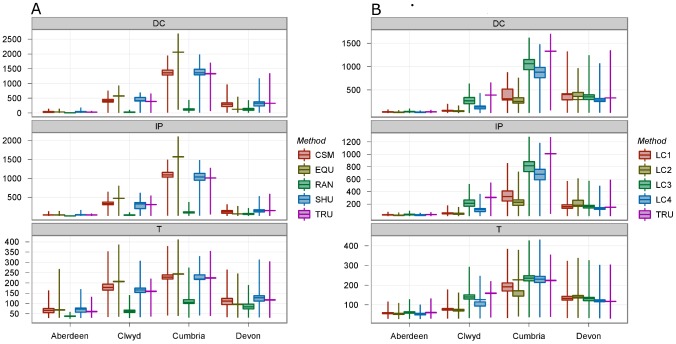
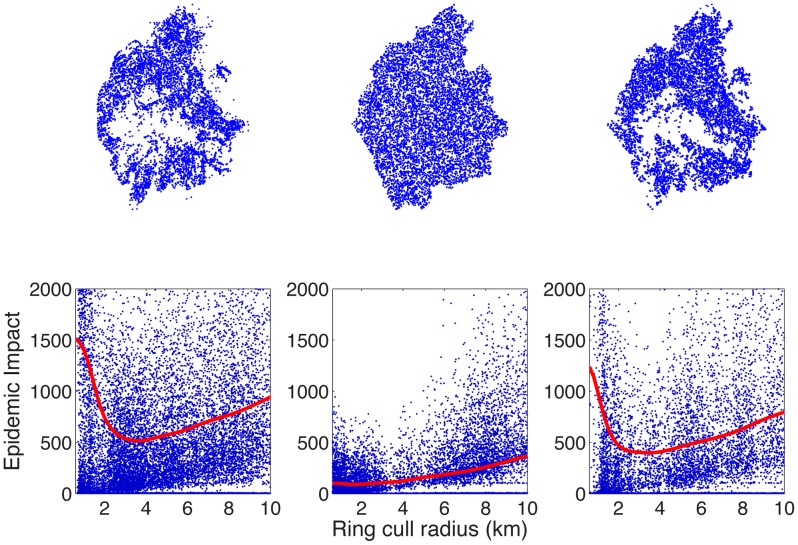
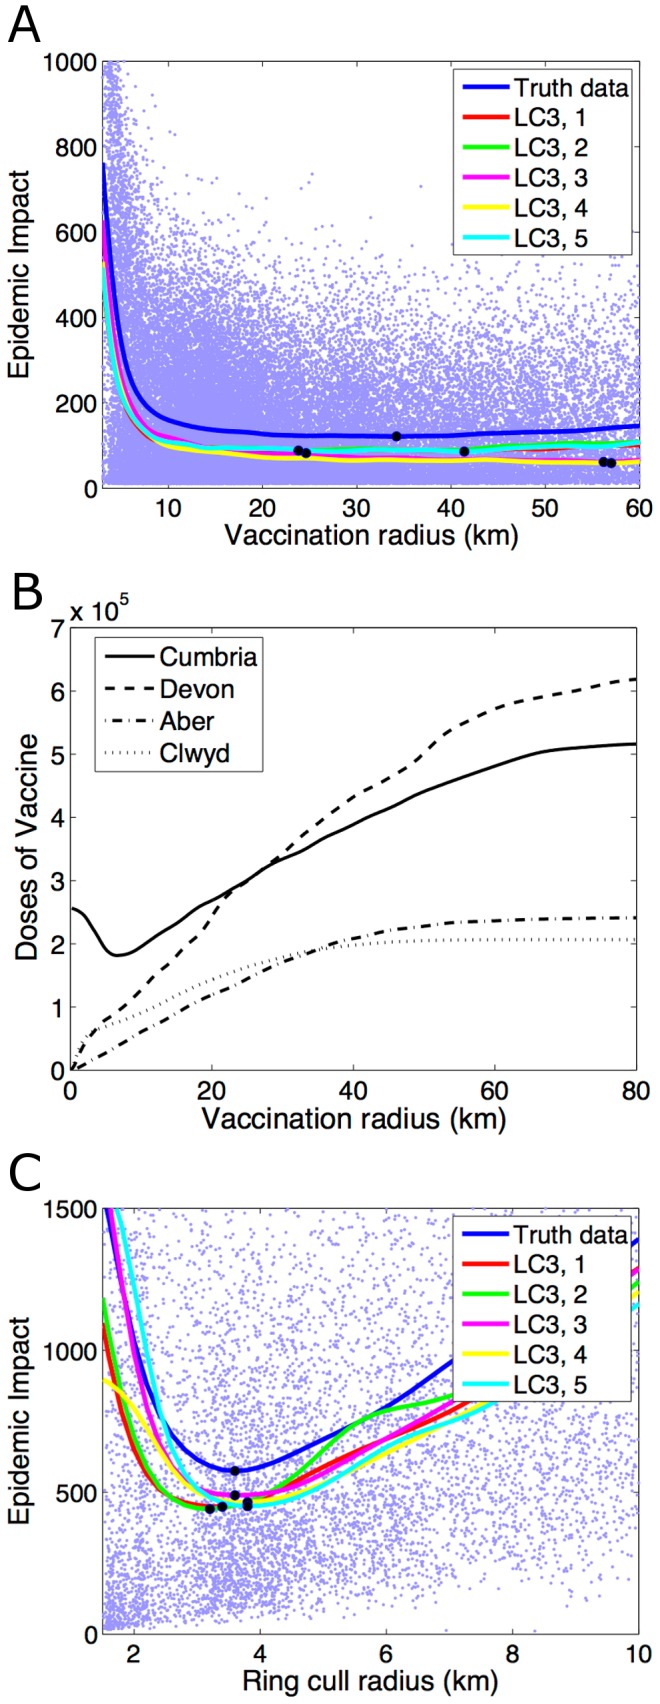
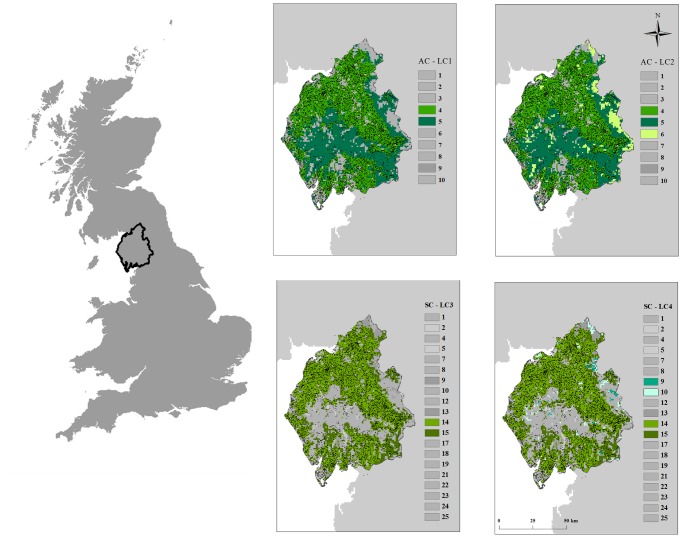
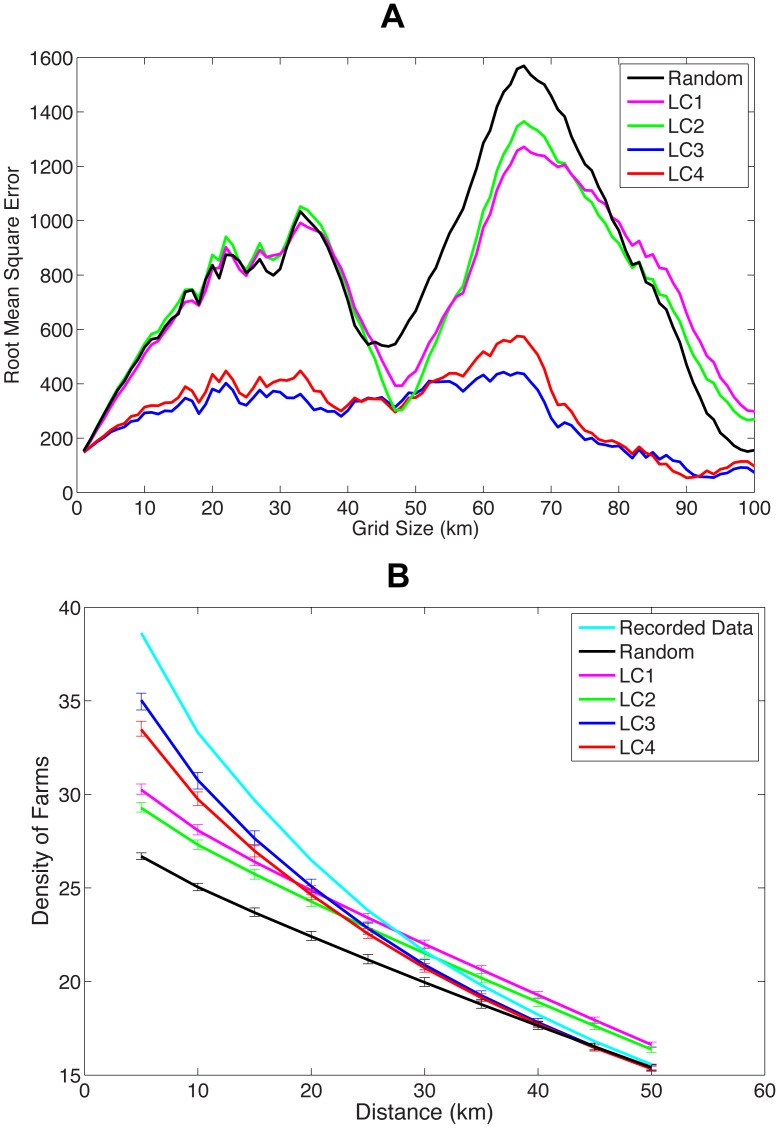
The availability of epidemiological data in the early stages of an outbreak of an infectious disease is vital for modelers to make accurate predictions regarding the likely spread of disease and preferred intervention strategies. However, in some countries, the necessary demographic data are only available at an aggregate scale. We investigated the ability of models of livestock infectious diseases to predict epidemic spread and obtain optimal control policies in the event of imperfect, aggregated data. Taking a geographic information approach, we used land cover data to predict UK farm locations and investigated the influence of using these synthetic location data sets upon epidemiological predictions in the event of an outbreak of foot-and-mouth disease. When broadly classified land cover data were used to create synthetic farm locations, model predictions deviated significantly from those simulated on true data. However, when more resolved subclass land use data were used, moderate to highly accurate predictions of epidemic size, duration and optimal vaccination and ring culling strategies were obtained. This suggests that a geographic information approach may be useful where individual farm-level data are not available, to allow predictive analyses to be carried out regarding the likely spread of disease. This method can also be used for contingency planning in collaboration with policy makers to determine preferred control strategies in the event of a future outbreak of infectious disease in livestock.
Conflict of interest statement
The authors have declared that no competing interests exist.
Figures
Similar articles
-
Realistic assumptions about spatial locations and clustering of premises matter for models of foot-and-mouth disease spread in the United States.PLoS Comput Biol. 2020 Feb 20;16(2):e1007641. doi: 10.1371/journal.pcbi.1007641. eCollection 2020 Feb. PLoS Comput Biol. 2020. PMID: 32078622 Free PMC article.
-
Transmission risks and control of foot-and-mouth disease in The Netherlands: spatial patterns.Epidemics. 2010 Mar;2(1):36-47. doi: 10.1016/j.epidem.2010.03.001. Epub 2010 Mar 15. Epidemics. 2010. PMID: 21352775
-
Optimal reactive vaccination strategies for a foot-and-mouth outbreak in the UK.Nature. 2006 Mar 2;440(7080):83-6. doi: 10.1038/nature04324. Nature. 2006. PMID: 16511494
-
Use and abuse of mathematical models: an illustration from the 2001 foot and mouth disease epidemic in the United Kingdom.Rev Sci Tech. 2006 Apr;25(1):293-311. doi: 10.20506/rst.25.1.1665. Rev Sci Tech. 2006. PMID: 16796055 Review.
-
The economic evaluation of control and eradication of epidemic livestock diseases.Rev Sci Tech. 1999 Aug;18(2):367-79. doi: 10.20506/rst.18.2.1169. Rev Sci Tech. 1999. PMID: 10472674 Review.
Cited by
-
iPAR: A framework for modelling and inferring information about disease spread when the populations at risk are unknown.PLoS Comput Biol. 2025 Jun 16;21(6):e1012622. doi: 10.1371/journal.pcbi.1012622. eCollection 2025 Jun. PLoS Comput Biol. 2025. PMID: 40523031 Free PMC article.
-
A scoping review of foot-and-mouth disease risk, based on spatial and spatio-temporal analysis of outbreaks in endemic settings.Transbound Emerg Dis. 2022 Nov;69(6):3198-3215. doi: 10.1111/tbed.14769. Epub 2022 Dec 13. Transbound Emerg Dis. 2022. PMID: 36383164 Free PMC article.
-
Identifying outbreak risk factors through case-controls comparisons.Commun Med (Lond). 2025 May 30;5(1):210. doi: 10.1038/s43856-025-00916-5. Commun Med (Lond). 2025. PMID: 40447926 Free PMC article. Review.
-
Spatial aggregation choice in the era of digital and administrative surveillance data.PLOS Digit Health. 2022 Jun 3;1(6):e0000039. doi: 10.1371/journal.pdig.0000039. eCollection 2022 Jun. PLOS Digit Health. 2022. PMID: 36812505 Free PMC article.
-
Does Size Matter to Models? Exploring the Effect of Herd Size on Outputs of a Herd-Level Disease Spread Simulator.Front Vet Sci. 2018 May 4;5:78. doi: 10.3389/fvets.2018.00078. eCollection 2018. Front Vet Sci. 2018. PMID: 29780811 Free PMC article.
References
-
- Anderson I (2002). Foot and Mouth Disease 2001: Lessons to be Learned Enquiry. London: The Stationary Office.
-
- Keeling MJ, Woolhouse MEJ, Shaw DJ, Matthews L, Chase-Topping ME, et al. (2001) Dynamics of the 2001 UK foot and mouth epidemic: stochastic dispersal in a heterogeneous landscape. Science 294: 813–817. - PubMed
-
- Ferguson NM, Donnelly CA, Anderson RM (2001a) Transmission intensity and impact of control policies on the foot and mouth epidemic in Great Britain. Nature 413: 542–548. - PubMed
-
- Diggle PJ (2006) Spatio-temporal point processes, partial likelihood, foot and mouth disease. Stat Methods Med Res 25: 325–336. - PubMed
Publication types
MeSH terms
Grants and funding
LinkOut - more resources
Full Text Sources
