

Determinants of translation elongation speed and ribosomal profiling biases in mouse embryonic stem cells
- PMID: 23133360
- PMCID: PMC3486846
- DOI: 10.1371/journal.pcbi.1002755
Determinants of translation elongation speed and ribosomal profiling biases in mouse embryonic stem cells
Abstract
Ribosomal profiling is a promising approach with increasing popularity for studying translation. This approach enables monitoring the ribosomal density along genes at a resolution of single nucleotides.In this study, we focused on ribosomal density profiles of mouse embryonic stem cells. Our analysis suggests, for the first time, that even in mammals such as M. musculus the elongation speed is significantly and directly affected by determinants of the coding sequence such as: 1) the adaptation of codons to the tRNA pool; 2) the local mRNA folding of the coding sequence; 3) the local charge of amino acids encoded in the codon sequence. In addition, our analyses suggest that in general, the translation velocity of ribosomes is slower at the beginning of the coding sequence and tends to increase downstream.Finally, a comparison of these data to the expected biophysical behavior of translation suggests that it suffers from some unknown biases. Specifically, the ribosomal flux measured on the experimental data increases along the coding sequence; however, according to any biophysical model of ribosomal movement lacking internal initiation sites, the flux is expected to remain constant or decrease. Thus, developing experimental and/or statistical methods for understanding, detecting and dealing with such biases is of high importance.
Conflict of interest statement
The authors have declared that no competing interests exist.
Figures
 and
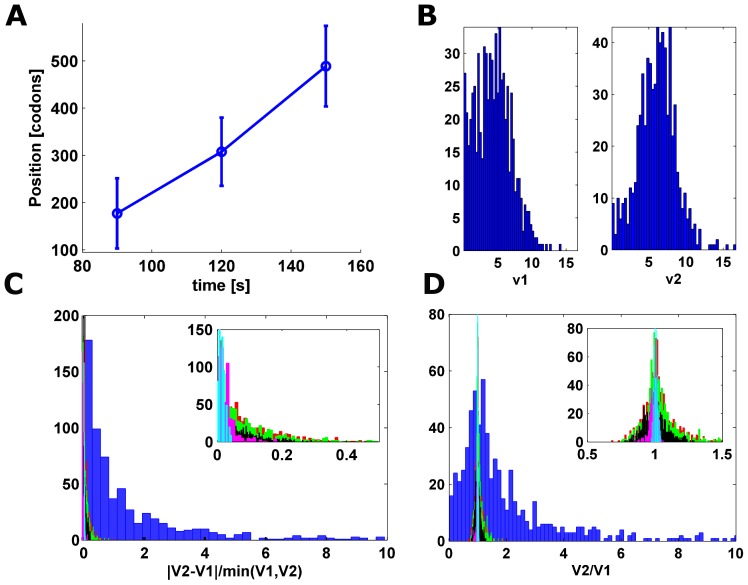
and  histograms. (C). Histogram of
  measure calculated on: 1) the experimental data (blue) (median value 0.82) 2) on simulated ribosomal densities of the analyzed isoforms for low/high/proportional initiation rates (green/red/black) and 3) ribosomal densities created using codons of equal translation efficiency for low/high initiation rates (magenta/teal). For the simulations, the obtained median values of the
  measures were 0.06/0.06/0.06/0.02/0.01, significantly lower than in the case of the experimental data (KS p-value <6.18*10−153 in all cases). The inset shows the ratio for the simulative data only. (D). Histogram of the
  ratio calculated on real and simulative data. The median value of this measure for the real ribosomal profiles was 1.37, significantly higher than for the simulative data, which resulted in median values of 1/1.01/1.01/1/1.01 accordantly (KS p-value <5.67*10−250 in all cases).
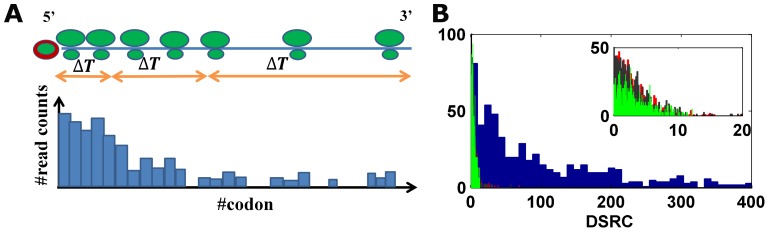
 histogram calculated on real (blue) and simulated ribosomal profiles for low/high/proportional initiation rates (black/red/green) with zero noise level. The calculated median value of this measure is 88/2.46/2.39/2.38 accordantly.
References
-
- Kimchi-Sarfaty C, Oh JM, Kim I-W, Sauna ZE, Calcagno AM, et al. (2007) A “Silent” Polymorphism in the MDR1 Gene Changes Substrate Specificity. Science 315: 525–528. - PubMed
-
- Gustafsson C, Govindarajan S, Minshull J (2004) Codon bias and heterologous protein expression. Trends Biotechnol 22: 346–353. - PubMed
Publication types
MeSH terms
Substances
LinkOut - more resources
Full Text Sources
