. 2012;8(11):e1002762.
doi: 10.1371/journal.pcbi.1002762. Epub 2012 Nov 1.

Phenomenological model for predicting the catabolic potential of an arbitrary nutrient

Affiliations

Phenomenological model for predicting the catabolic potential of an arbitrary nutrient

Samuel M D Seaver et al. PLoS Comput Biol. 2012.

Abstract

The ability of microbial species to consume compounds found in the environment to generate commercially-valuable products has long been exploited by humanity. The untapped, staggering diversity of microbial organisms offers a wealth of potential resources for tackling medical, environmental, and energy challenges. Understanding microbial metabolism will be crucial to many of these potential applications. Thermodynamically-feasible metabolic reconstructions can be used, under some conditions, to predict the growth rate of certain microbes using constraint-based methods. While these reconstructions are powerful, they are still cumbersome to build and, because of the complexity of metabolic networks, it is hard for researchers to gain from these reconstructions an understanding of why a certain nutrient yields a given growth rate for a given microbe. Here, we present a simple model of biomass production that accurately reproduces the predictions of thermodynamically-feasible metabolic reconstructions. Our model makes use of only: i) a nutrient's structure and function, ii) the presence of a small number of enzymes in the organism, and iii) the carbon flow in pathways that catabolize nutrients. When applied to test organisms, our model allows us to predict whether a nutrient can be a carbon source with an accuracy of about 90% with respect to in silico experiments. In addition, our model provides excellent predictions of whether a medium will produce more or less growth than another (p<10(-6)) and good predictions of the actual value of the in silico biomass production.


Conflict of interest statement

The authors have declared that no competing interests exist.

Figures

Figure 1
Figure 1. Schematic representation of the development of a model for maximum biomass production in complex media of microbial organisms.
We aim at developing a phenomenological model to predict the maximum biomass production B m of species s when growing in a medium containing a set of nutrients {i} acting as a carbon source under aerobic conditions. That is, we want to express B m as a function f ({i}, s) that only takes into account data related to: i) the set of nutrients {i} available, namely, nutrient type, the set of pathways {p(i)} that can catabolize each nutrient, and the carbon content Ci of each nutrient; and ii) the species s, specifically the presence or not of certain enzymes in a species that allow to catabolize specific types of nutrients (enzymes EC: 1.1.1.35, EC: 2.3.1.16, and EC 3.5.2.17 - see text). In order to achieve our goal, there are three different questions we need to answer: i) Does nutrient i produce growth or not in species s when acting as the sole source of carbon? We find that whether nutrient i produces growth (G) or not (NG) is a function of the nutrient type (see text) and its pathway membership; (ii) If a nutrient produces growth, what is the maximal biomass formula image 
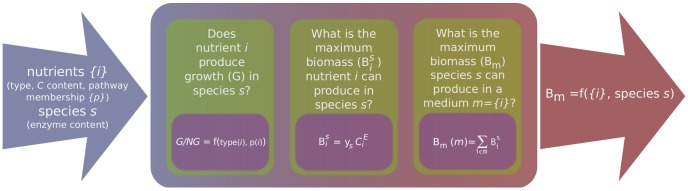
it can produce in species s when acting as the sole source of carbon? We find that formula image is proportional to Ci, the number of carbons in nutrient i, and that the proportionality constant y s depends on the species s. iii) What is the maximal biomass production B 
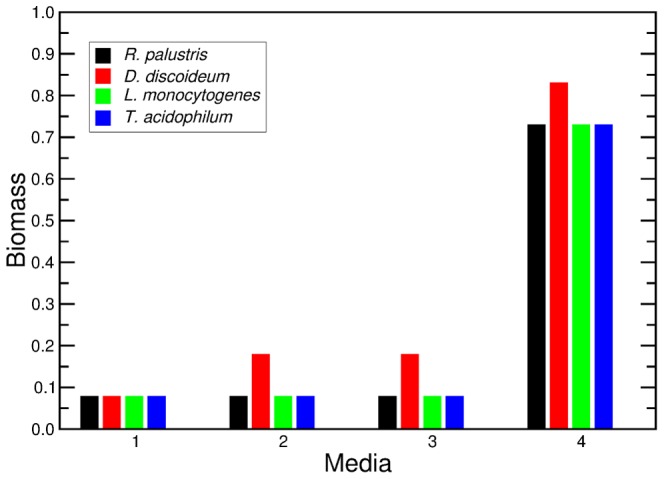
m(m) when growing on a complex medium m? We find that B m(m) can be well approximated by adding up the individual contributions formula image of nutrients i present in medium m.
Figure 2
Figure 2. Determining whether a nutrient can or cannot be catabolized.
A, To establish whether a given nutrient is a source of carbon for a given organism, we first need to determine whether the nutrient can be transported into the cell from the extracellular medium. B, For some nutrients, we can predict if a it does or does not contribute to growth just from knowing to which class it belongs. Complex nutrients are broken down into simple nutrients. See the main text for the description of the enzymes that catabolize fatty acids and purines. C, Any nutrient that is not classified into the nutrient classes in B is classified as G or NG using the logistic model described in the text and Methods.
Figure 3
Figure 3. Nutrients uptaken and that stimulate growth in the presence of minimal media for the organisms in the training set.
A, E. coli and B. subtilis have the largest number of uptaken nutrients whereas M. barkeri has the fewest. This reflects the current understanding of M. barkeri as a specialized methanogen . B, E. coli and B. subtilis are able to catabolize half of the nutrients they uptake whereas M. barkeri can catabolize less than 10% of the nutrients it uptakes. C, Number of uptaken nutrients by nutrient class. Within each class, the four organisms uptake approximately the same number of nutrients. Exceptions are M. barkeri—which does not uptake neither Fatty acids nor Sugars, and only one Sugar derivative—and B. subtilis—which is not assumed to uptake Fatty acids in the in silico reconstruction. D, Fraction of uptaken nutrients that stimulate growth by nutrient class. There is a consistent pattern of growth stimulation across all four species for six nutrient classes: Sugars, Sugar derivatives, and Purines are catabolized whilst Inorganic compounds, Pyrimidines, Cofactors, and compounds involved in the formation of the cell membrane or cell wall (Cell boundary class) are not catabolized.
Figure 4
Figure 4. Model selection.
We consider logistic models with different number of pathways P and of pairs of pathways z (see text and Methods). A, Model accuracy. We calculate the true positive (TP) and true negative (TN) rates for the different models. TP reflects whether the model correctly predicts G nutrients, whilst the TN reflects whether the model correctly predicts NG nutrients. B, Area under the ROC curve (AUC) for the 10 models. The higher the AUC, the better the model is at separating G nutrients from NG nutrients. C, Akaike information criterion (AIC) and Bayesian information criterion (BIC) of the 10 models. The lower the information criterion, the more parsimonious the model. We could not identify any additional pathways and/or pathway pairs that improved the AIC and BIC of the model with P = 8, z = 2 (pathways and pathway pairs are listed in the upper right panel of the figure). In the case of TP, TN, and AUC, we apply our complete model including both nutrient classes and KEGG pathways to the training set of organisms, and to the test set of organisms (see text and Methods). When P = 0, z = 0, there are more NG nutrients than G nutrients that are not included in a nutrient class, therefore all of these nutrients are considered iNG; hence, the initially low TN rate. When P≥4, the TP in the test set is similar to the TP in the training set. This means that our model is successful at identifying G nutrients. However, the TN for the test set is slightly lower than the TN for the training set. This occurs because there are more NG nutrients in the test set that are also found in the Sugar and Sugar derivative classes, or in G pathways in the linear model, which we could not account for because of the small sample size of the training set. The difference between the TN rates of the two test sets has an impact on the overall accuracy of the model for the training and test sets.
Figure 5
Figure 5. Breakdown of true positives and true negatives in training and test sets.
Solid red indicates true positives. Solid blue indicates true negatives. Hashed red indicates false positives. Hashed blue indicates false negatives. If our model was 100% accurate, the solid red bars would add up to 100%, as would the solid blue bars. It is visually apparent that the majority of false positives and false negatives are due to misclassification using the KEGG pathways.
Figure 6
Figure 6. Biomass production is related to the number of carbons in a nutrient.
We show the optimized biomass production of each species on G nutrients, for species in the training set (left) and the test set (right). For all species there is a positive correlation between biomass production and the number of carbons in the nutrient. The blue line represents formula image 
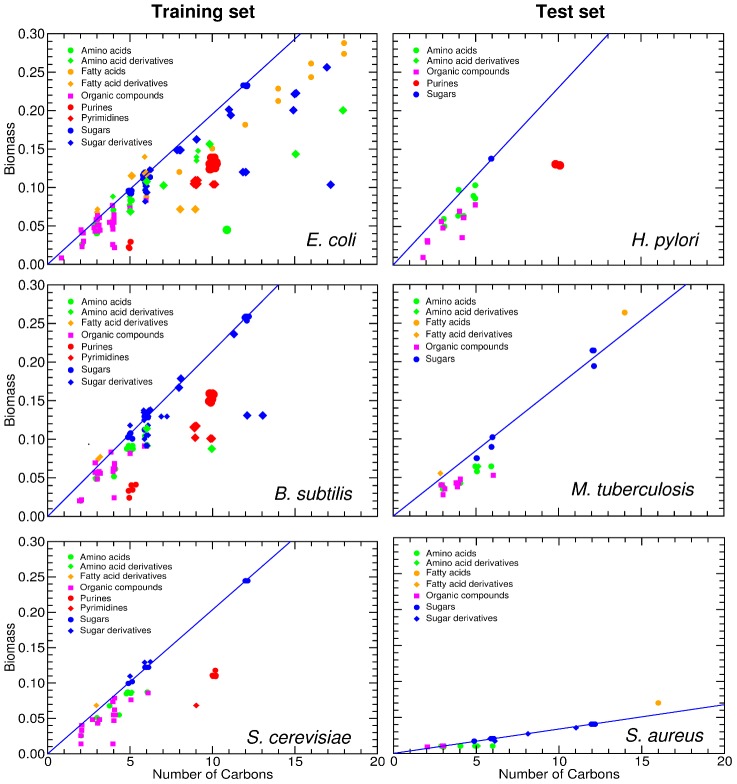
(see text) for all the sugars uptaken by species s. S. aureus exhibits a reduced biomass production; the biomass defined in the in silico organisms demands approximately ten times more moles relative to the other species. In all the plots, the position of the nutrients on the X axis is slightly staggered so that all data points are visible. Note that the symbols for the complex nutrients are enlarged.
Figure 7
Figure 7. Normalized biomass yield for nutrient classes.
The panels show the normalized biomass yield formula image 
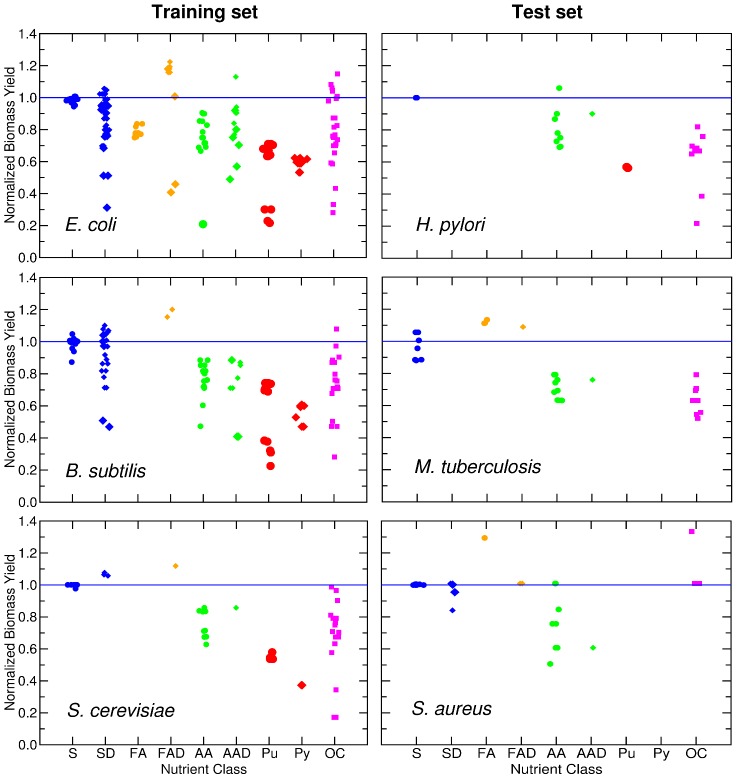
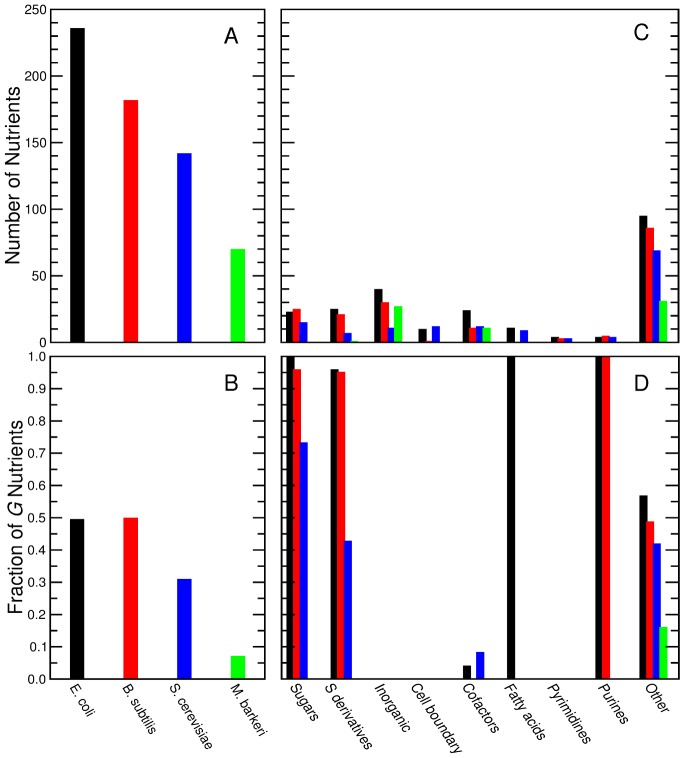
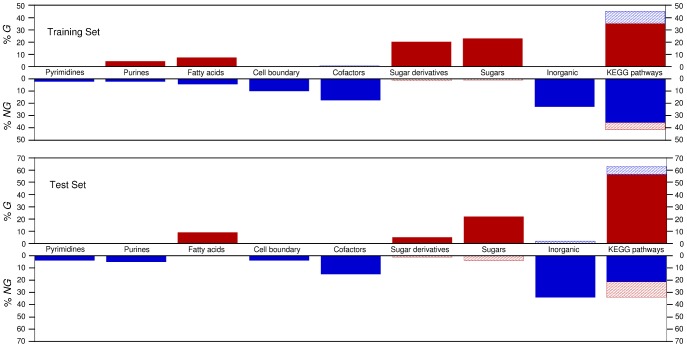
of G nutrients for species in the training set (left) and in the test set (right). Nutrients are grouped by their nutrient class (with positions in the X axis staggered so as to allow one to see all of them). The blue line represents formula image for all the sugars uptaken by species s. The symbols for complex nutrients are enlarged.
Figure 8
Figure 8. Adjusting for the effective number of carbons in complex nutrients and purines in the training set.
We show the normalized biomass yield (see Fig. 7) for purines and complex nutrients (full colored symbols) for species in the training set. In the left column, we show the normalized biomass yield considering the number of carbons in each nutrient Ci. In the right column, we show the normalized biomass yield using the effective number of carbons formula image 
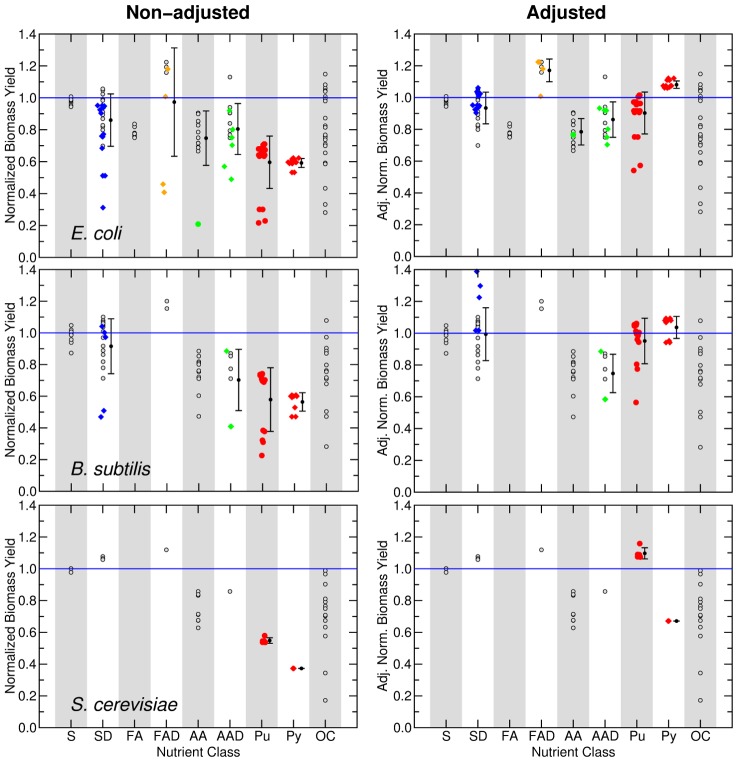
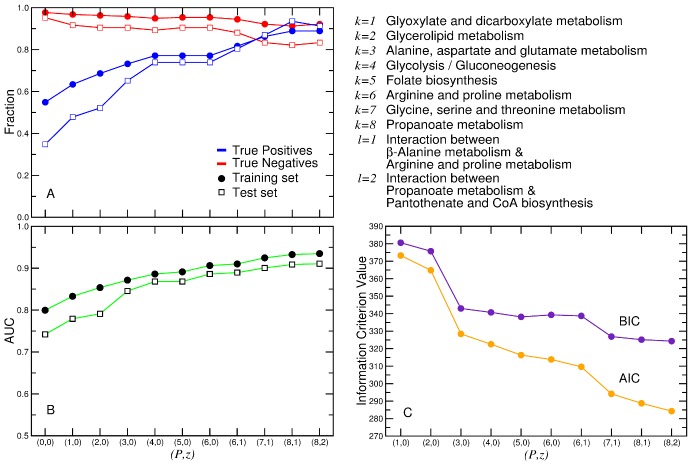
(see Text and Methods). Additionally, for each nutrient class that contains these nutrients, we show the mean and variance.
Figure 9
Figure 9. Validation of the model for biomass production on complex media.
We show, for 3000 randomly generated complex media containing sugars, fatty acids, bases, and amino acids (see Methods), the prediction for the biomass production as a function of the actual in silico growth. We show the results for E. coli, B. subtilis, S. cerevisiae, H. pylori, and M. tuberculosis. The dashed lines represent a regression of the predicted biomass production versus experimental in silico productionformula image
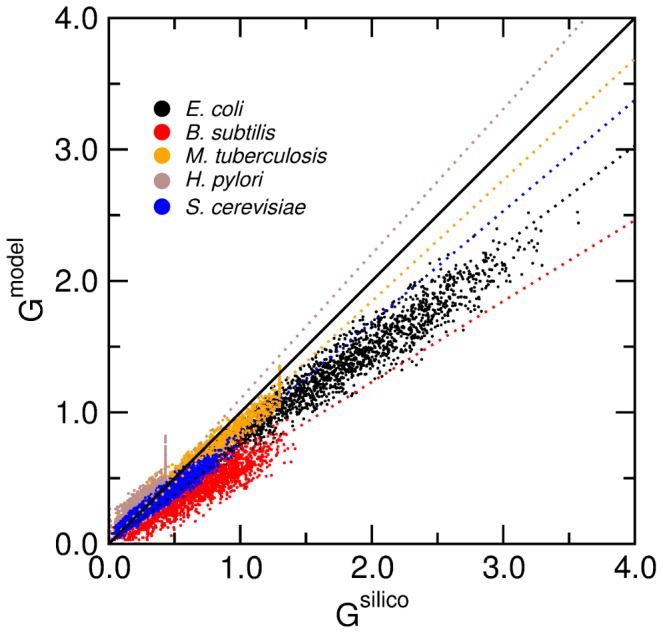
. We obtain: K = 0.76 for E. coli, K = 0.62 for B. subtilis, K = 0.84 for S. cerevisiae, K = 1.10 for H. pylori, and K = 0.92 for M. tuberculosis.
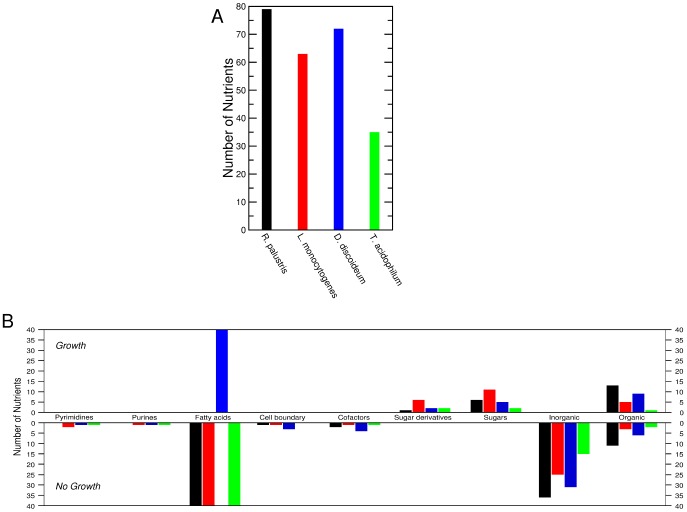
Figure 10
Figure 10. Predictions for four organisms lacking a metabolic reconstruction.
A, The number of nutrients found to be uptaken by four organisms for which we lack a metabolic reconstruction: Rhodopseudomonas palustris (gram-negative bacterium), Listeria monocytogenes (gram-positive bacterium), Dictyostelium discoideum (eukaryote), and Thermoplasma acidophilum (archaeon). The nutrients were determined using predictions found in TransportDB (http://www.transportdb.org). B, Prediction of whether a nutrient is a source of carbon according to class. Bars in the top panel represent predictions of G nutrients, whereas bars in the bottom panel represent predictions of NG nutrients. None of the species had fatty acids listed as nutrients, but since fatty acids can be uptaken by diffusing through the cell membrane, we show here the predictions for fatty acids as well. The prediction for nutrients in the Organic compounds class are based on our logistic regression using the KEGG pathway terms. Thus some nutrients are predicted to be G while others are predicted to be NG.
Figure 11
Figure 11. Predictions of biomass production for four organisms lacking a metabolic reconstruction.
The predictions are made for the biomass production of R. palustris, D. discoideum, T. acidophilum, and L. monocytogenes. For the predictions of biomass production, we use four different complex media containing: 1) Glucose 2) Glucose and hexanoic acid 3) Glucose, hexanoic acid, guanine, adenine, cytosine, and thymine. 4) Glucose, hexanoic acid, guanine, adenine, cytosine, thymine, and the 20 natural amino acids (see Methods). There is no difference in the prediction for biomass production between complex media 2 and 3 because none of the species shown here can catabolize nucleobases. The large number of carbons available in the 20 natural amino acids are responsible for the increase in biomass production predicted for complex medium 4.

Similar articles

Cited by

References

    1. Stephanopoulos G (2007) Challenges in engineering microbes for biofuels production. Science 315: 801–804. - PubMed
    1. Timmis KN, Steffan RJ, Unterman R (1994) Designing microorganisms for the treatment of toxic wastes. Annual Review of Microbiology 48: 525–557. - PubMed
    1. Faulwetter JL, Gagnon V, Sundberg C, Chazarenc F, Burr MD, et al. (2009) Microbial processes influencing performance of treatment wetlands: A review. Ecological Engineering 35: 987–1004.
    1. Keasling JD (2010) Manufacturing molecules through metabolic engineering. Science 330: 1355–1358. - PubMed
    1. Levine AJ, Puzio-Kuter AM (2010) The control of the metabolic switch in cancers by oncogenes and tumor suppressor genes. Science 330: 1340–1344. - PubMed

Publication types

LinkOut - more resources