

Structural insights into the inhibition of actin-capping protein by interactions with phosphatidic acid and phosphatidylinositol (4,5)-bisphosphate
- PMID: 23133367
- PMCID: PMC3486809
- DOI: 10.1371/journal.pcbi.1002765
Structural insights into the inhibition of actin-capping protein by interactions with phosphatidic acid and phosphatidylinositol (4,5)-bisphosphate
Abstract
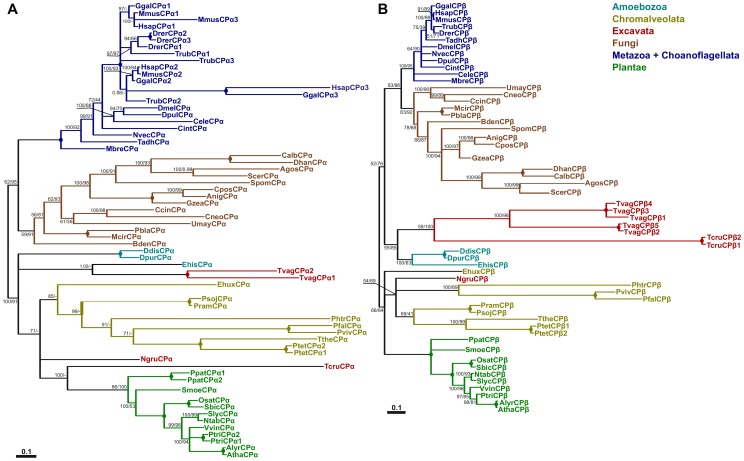
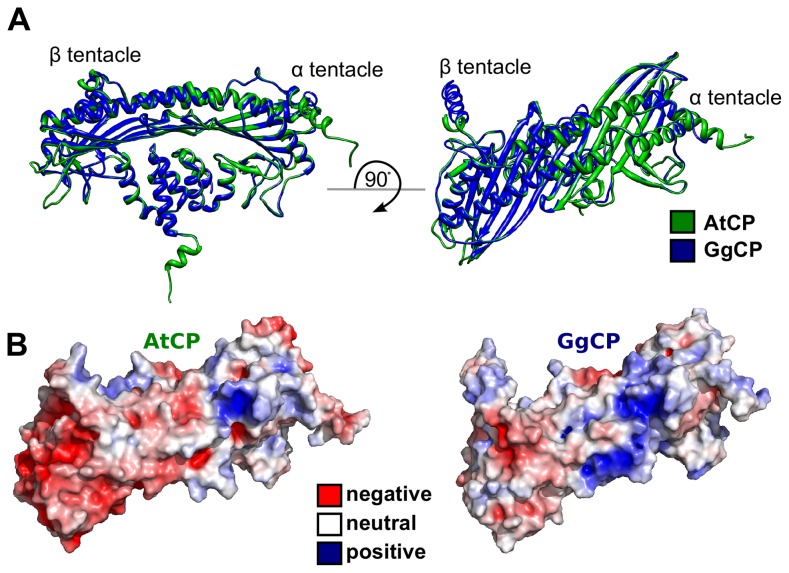
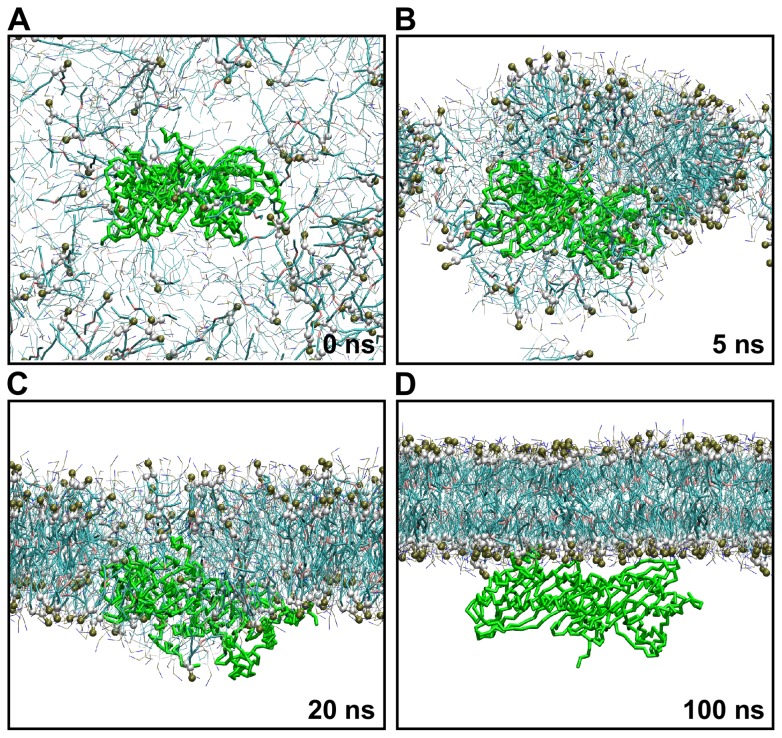
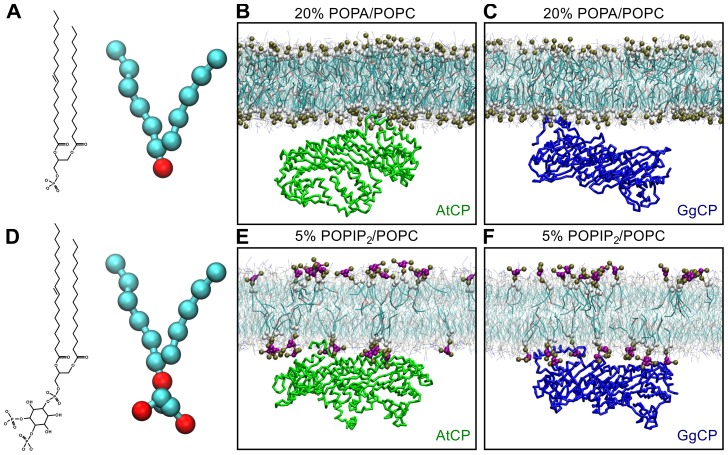
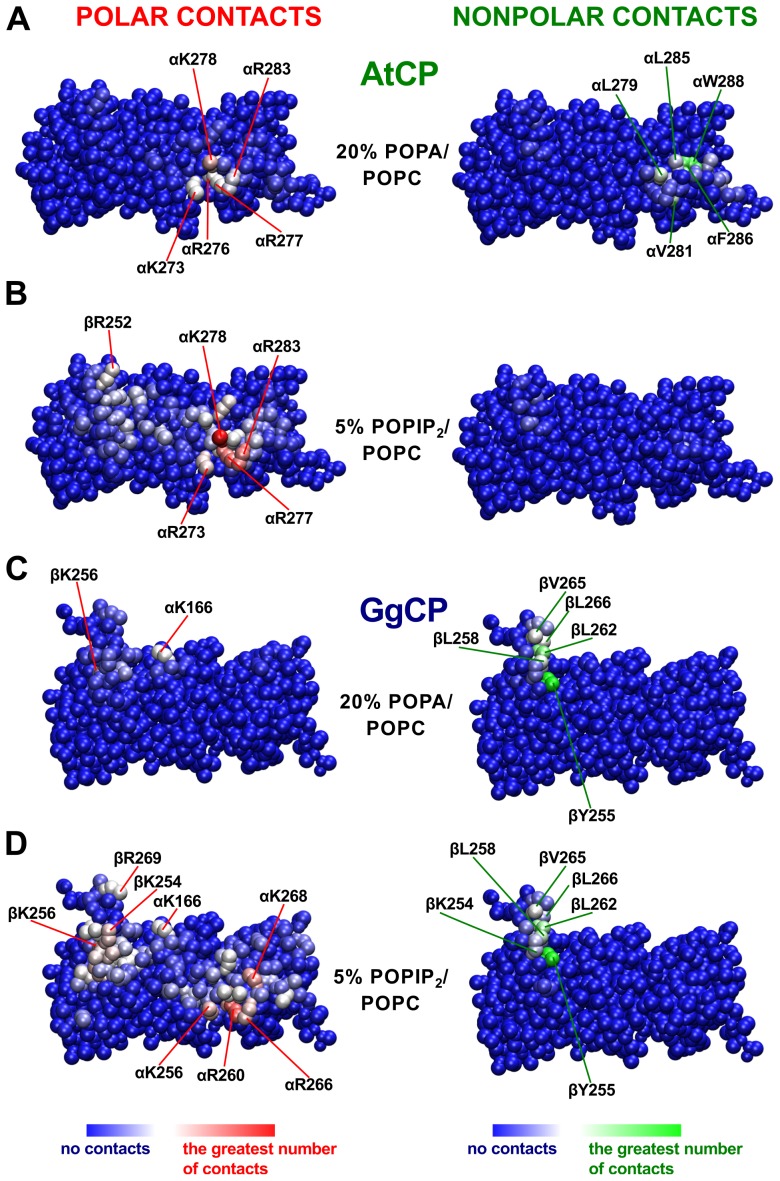
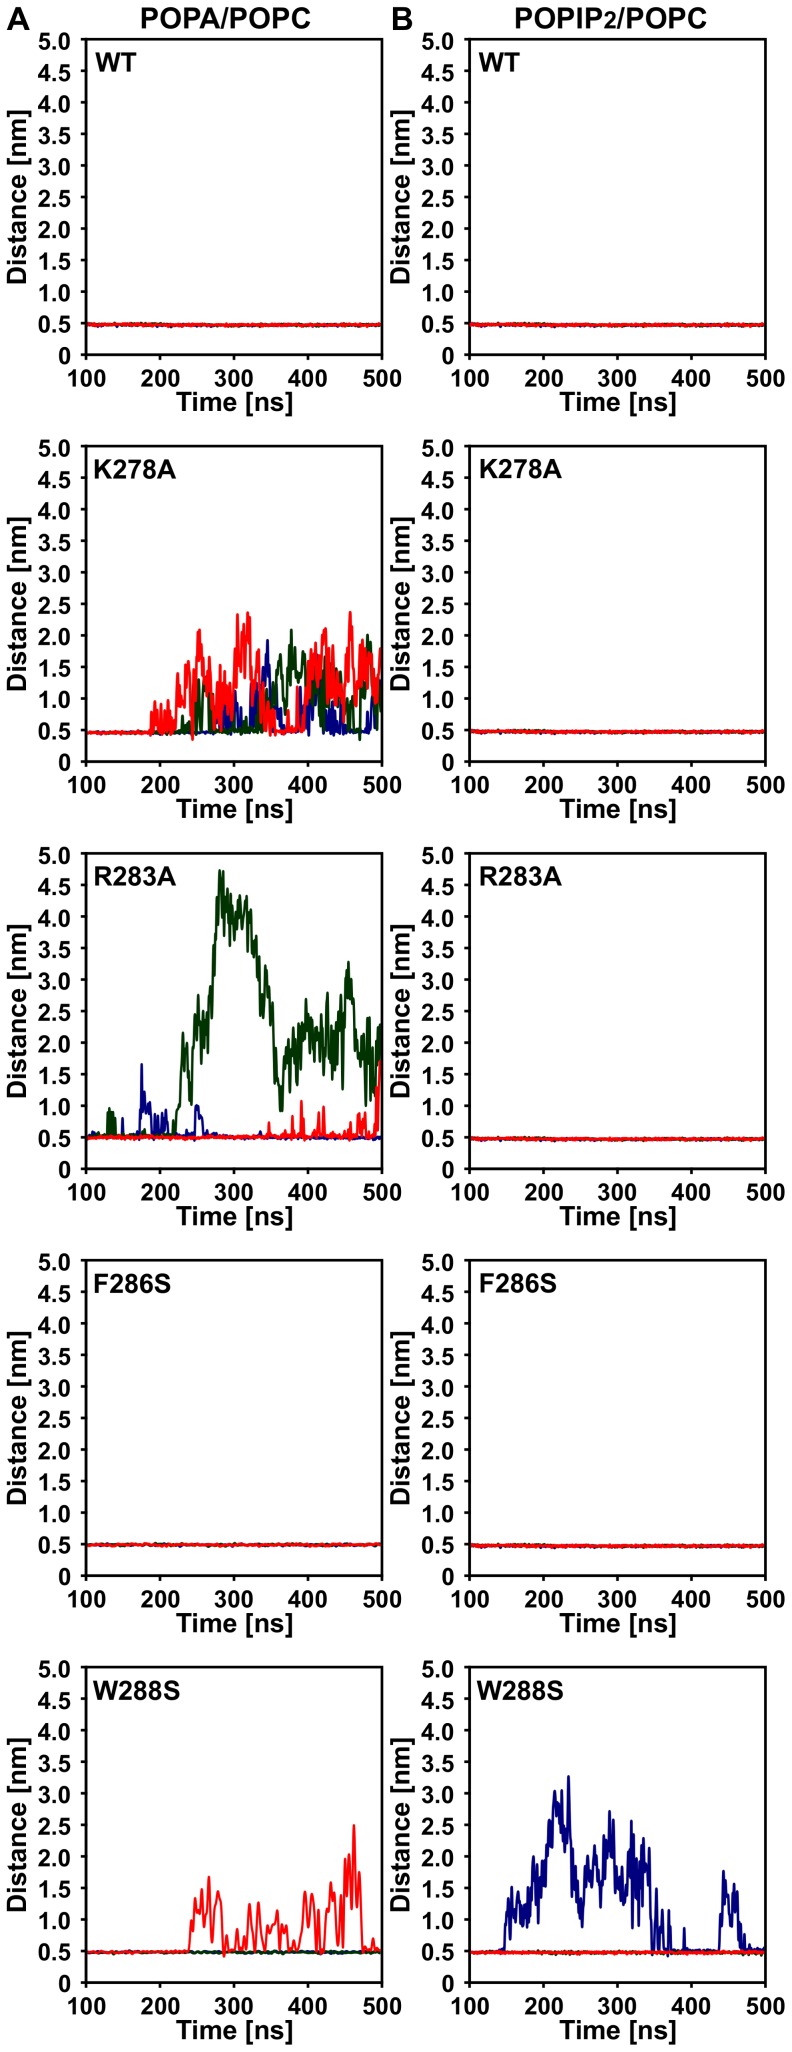
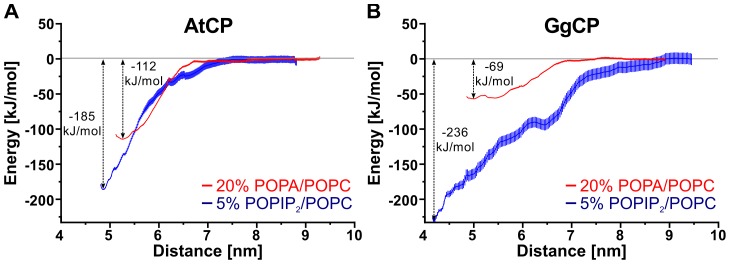
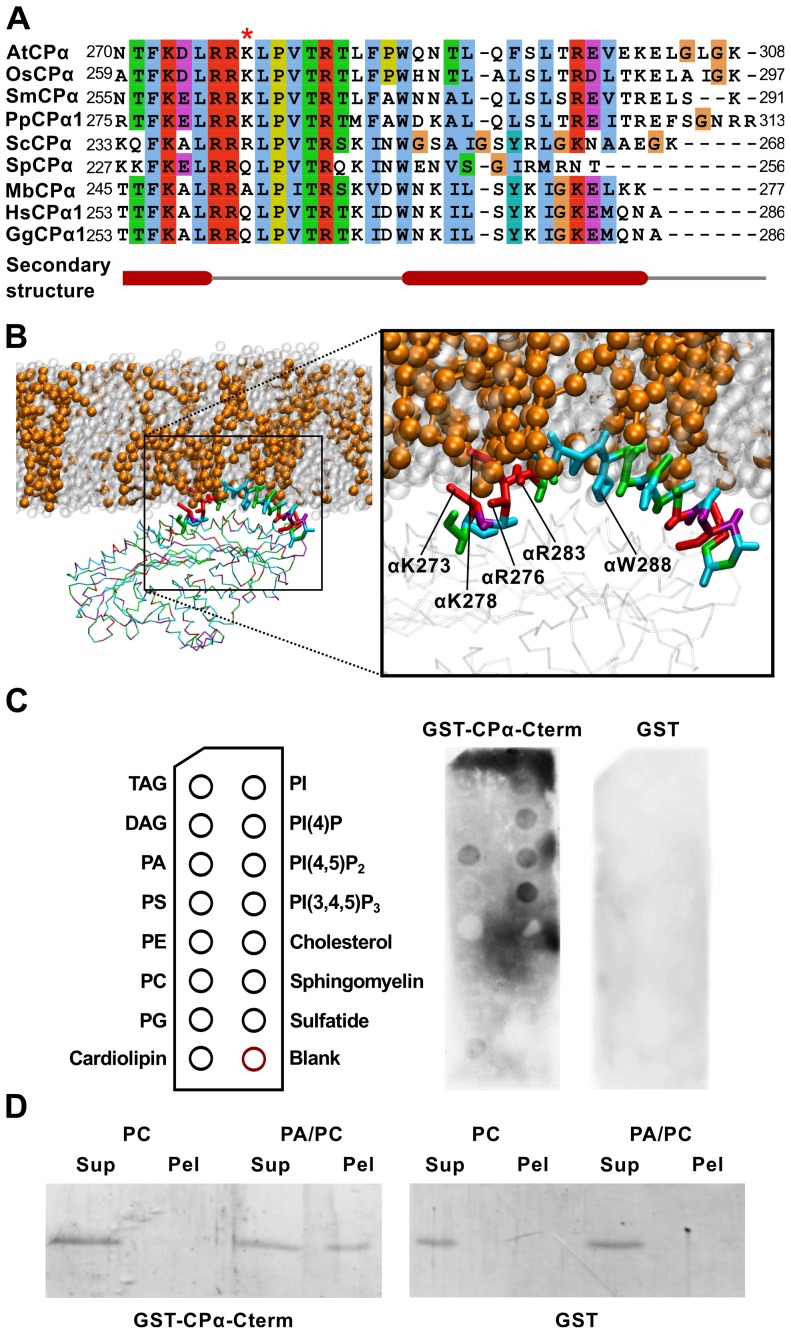
The actin cytoskeleton is a dynamic structure that coordinates numerous fundamental processes in eukaryotic cells. Dozens of actin-binding proteins are known to be involved in the regulation of actin filament organization or turnover and many of these are stimulus-response regulators of phospholipid signaling. One of these proteins is the heterodimeric actin-capping protein (CP) which binds the barbed end of actin filaments with high affinity and inhibits both addition and loss of actin monomers at this end. The ability of CP to bind filaments is regulated by signaling phospholipids, which inhibit the activity of CP; however, the exact mechanism of this regulation and the residues on CP responsible for lipid interactions is not fully resolved. Here, we focus on the interaction of CP with two signaling phospholipids, phosphatidic acid (PA) and phosphatidylinositol (4,5)-bisphosphate (PIP(2)). Using different methods of computational biology such as homology modeling, molecular docking and coarse-grained molecular dynamics, we uncovered specific modes of high affinity interaction between membranes containing PA/phosphatidylcholine (PC) and plant CP, as well as between PIP(2)/PC and animal CP. In particular, we identified differences in the binding of membrane lipids by animal and plant CP, explaining previously published experimental results. Furthermore, we pinpoint the critical importance of the C-terminal part of plant CPα subunit for CP-membrane interactions. We prepared a GST-fusion protein for the C-terminal domain of plant α subunit and verified this hypothesis with lipid-binding assays in vitro.
Conflict of interest statement
The authors have declared that no competing interests exist.
Figures
Similar articles
-
Heterodimeric capping protein from Arabidopsis is regulated by phosphatidic acid.Mol Biol Cell. 2006 Apr;17(4):1946-58. doi: 10.1091/mbc.e05-09-0840. Epub 2006 Jan 25. Mol Biol Cell. 2006. PMID: 16436516 Free PMC article.
-
Capping protein modulates the dynamic behavior of actin filaments in response to phosphatidic acid in Arabidopsis.Plant Cell. 2012 Sep;24(9):3742-54. doi: 10.1105/tpc.112.103945. Epub 2012 Sep 7. Plant Cell. 2012. PMID: 22960908 Free PMC article.
-
Structure/function analysis of the interaction of phosphatidylinositol 4,5-bisphosphate with actin-capping protein: implications for how capping protein binds the actin filament.J Biol Chem. 2007 Feb 23;282(8):5871-9. doi: 10.1074/jbc.M609850200. Epub 2006 Dec 19. J Biol Chem. 2007. PMID: 17182619 Free PMC article.
-
Capping protein regulators fine-tune actin assembly dynamics.Nat Rev Mol Cell Biol. 2014 Oct;15(10):677-89. doi: 10.1038/nrm3869. Epub 2014 Sep 10. Nat Rev Mol Cell Biol. 2014. PMID: 25207437 Free PMC article. Review.
-
New insights into mechanism and regulation of actin capping protein.Int Rev Cell Mol Biol. 2008;267:183-206. doi: 10.1016/S1937-6448(08)00604-7. Int Rev Cell Mol Biol. 2008. PMID: 18544499 Free PMC article. Review.
Cited by
-
Physiological role of actin regulation in male fertility: Insight into actin capping proteins in spermatogenic cells.Reprod Med Biol. 2020 Jan 22;19(2):120-127. doi: 10.1002/rmb2.12316. eCollection 2020 Apr. Reprod Med Biol. 2020. PMID: 32273816 Free PMC article.
-
Arabidopsis capping protein senses cellular phosphatidic acid levels and transduces these into changes in actin cytoskeleton dynamics.Plant Signal Behav. 2012 Dec;7(12):1727-30. doi: 10.4161/psb.22472. Epub 2012 Oct 16. Plant Signal Behav. 2012. PMID: 23072985 Free PMC article.
-
Phosphatidic Acid in Plant Hormonal Signaling: From Target Proteins to Membrane Conformations.Int J Mol Sci. 2022 Mar 17;23(6):3227. doi: 10.3390/ijms23063227. Int J Mol Sci. 2022. PMID: 35328648 Free PMC article. Review.
-
When fat is not bad: the regulation of actin dynamics by phospholipid signaling molecules.Front Plant Sci. 2014 Jan 23;5:5. doi: 10.3389/fpls.2014.00005. eCollection 2014. Front Plant Sci. 2014. PMID: 24478785 Free PMC article. Review.
-
The availability of filament ends modulates actin stochastic dynamics in live plant cells.Mol Biol Cell. 2014 Apr;25(8):1263-75. doi: 10.1091/mbc.E13-07-0378. Epub 2014 Feb 12. Mol Biol Cell. 2014. PMID: 24523291 Free PMC article.
References
-
- Staiger CJ, Blanchoin L (2006) Actin dynamics: old friends with new stories. Curr Opin Plant Biol 9: 554–562. - PubMed
-
- Blanchoin L, Boujemaa-Paterski R, Henty JL, Khurana P, Staiger CJ (2010) Actin dynamics in plant cells: a team effort from multiple proteins orchestrates this very fast-paced game. Curr Opin Plant Biol 13: 714–723. - PubMed
Publication types
MeSH terms
Substances
LinkOut - more resources
Full Text Sources
Research Materials
Miscellaneous
