. 2012;8(11):e1003010.
doi: 10.1371/journal.ppat.1003010. Epub 2012 Nov 1.

Histone H1 plays a role in heterochromatin formation and VSG expression site silencing in Trypanosoma brucei

Affiliations

Histone H1 plays a role in heterochromatin formation and VSG expression site silencing in Trypanosoma brucei

Megan L Povelones et al. PLoS Pathog. 2012.

Abstract

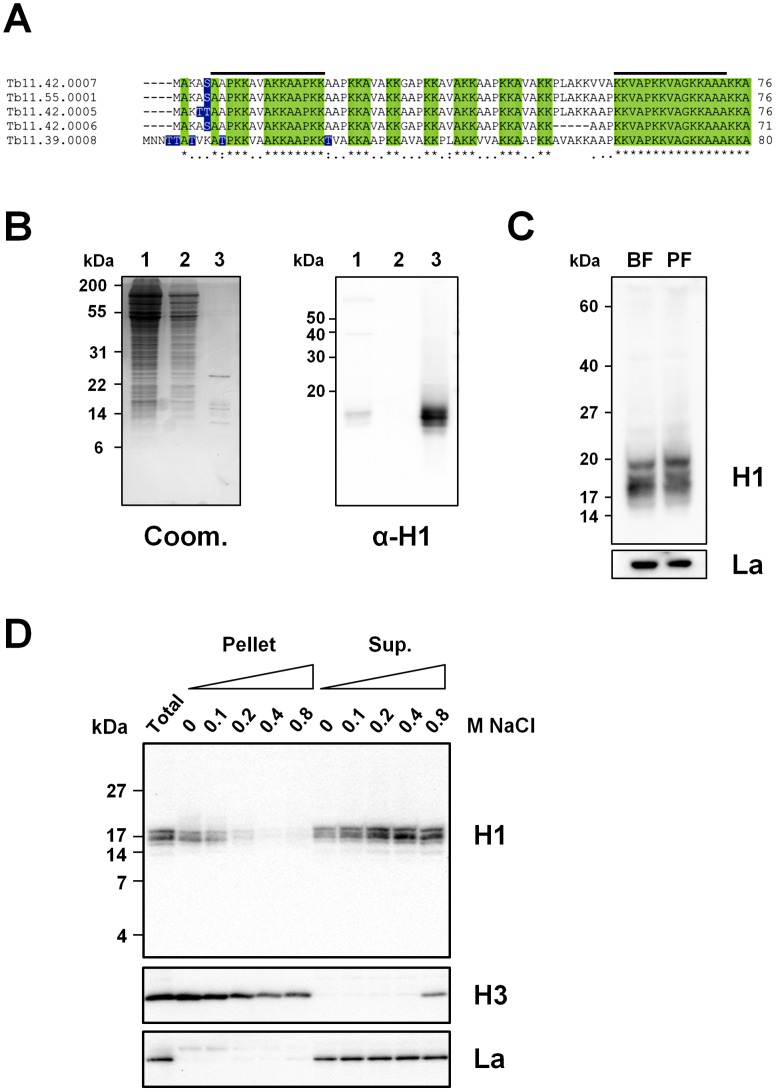
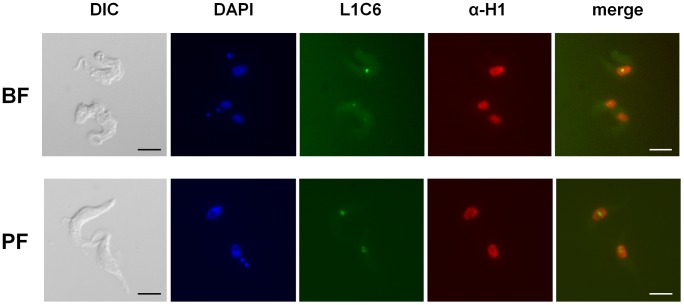
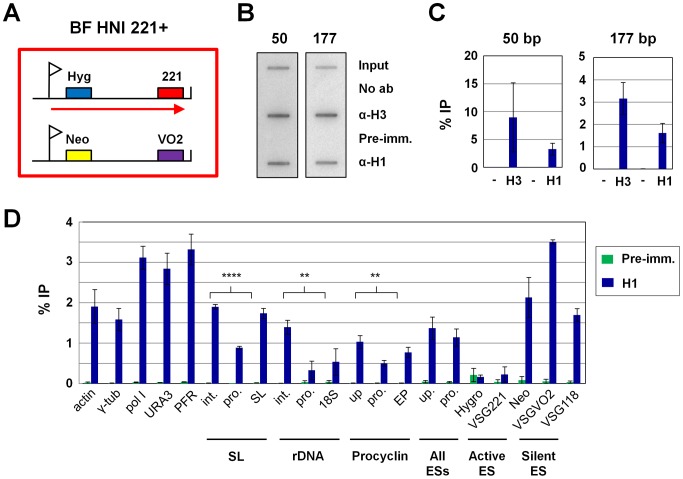
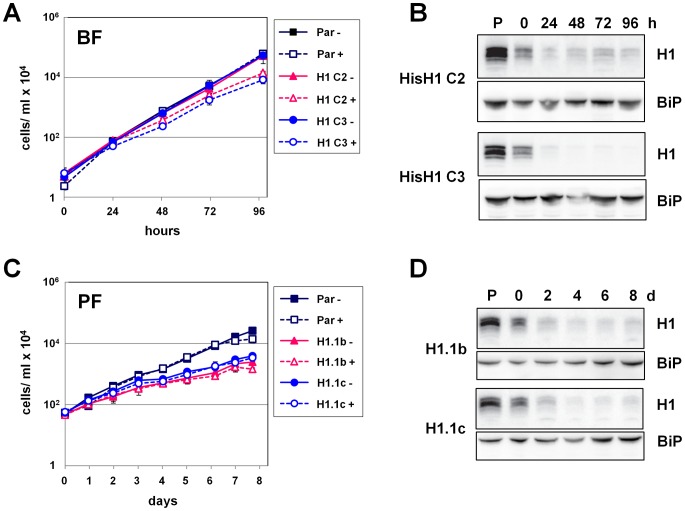
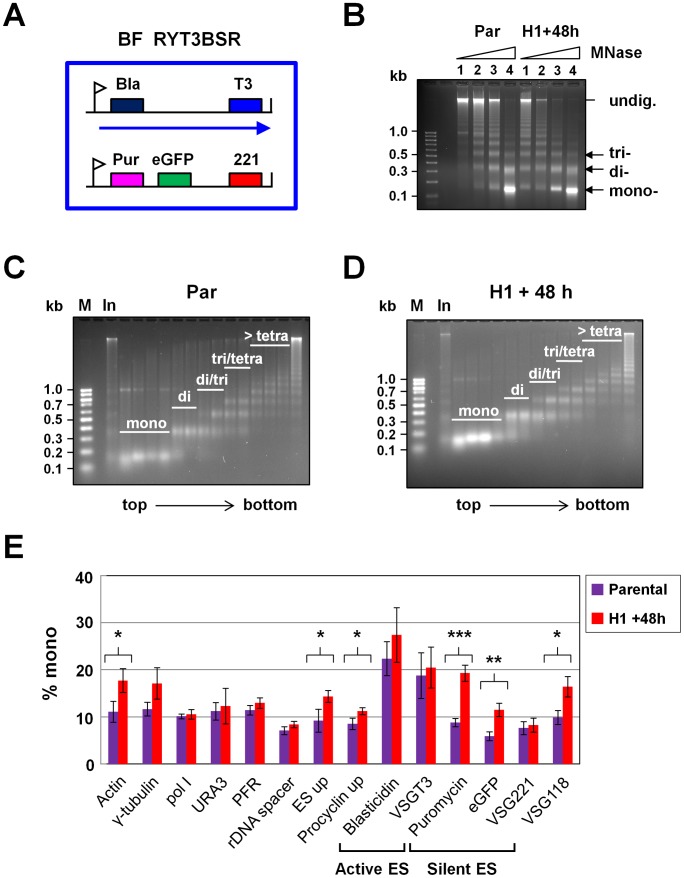
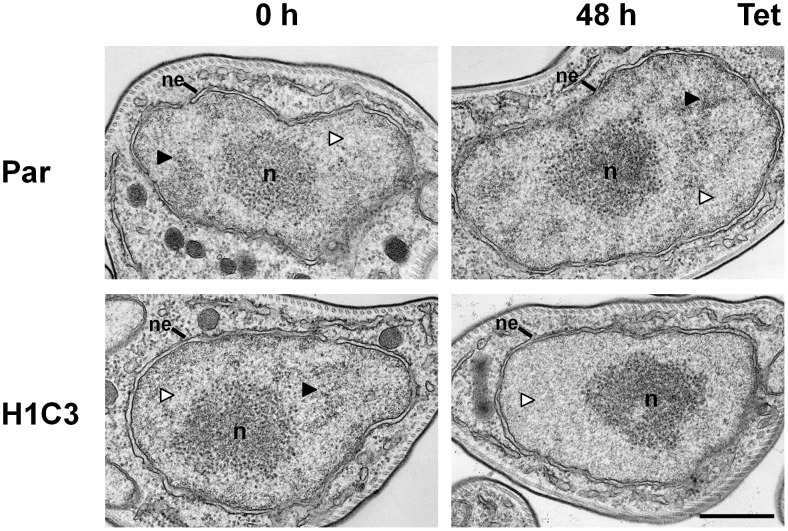
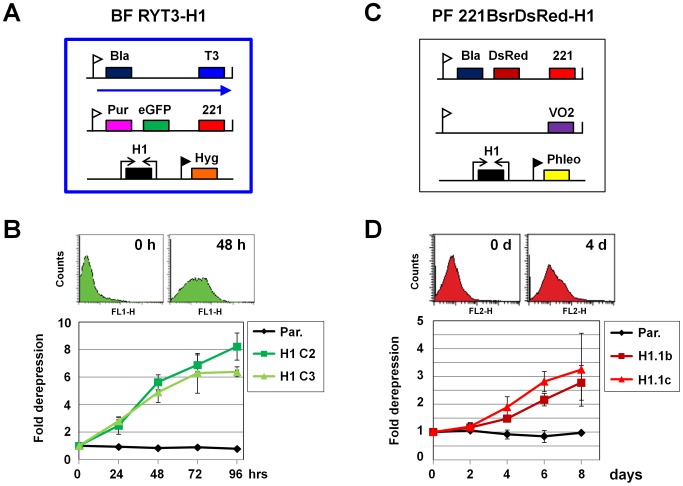
The African sleeping sickness parasite Trypanosoma brucei evades the host immune system through antigenic variation of its variant surface glycoprotein (VSG) coat. Although the T. brucei genome contains ∼1500 VSGs, only one VSG is expressed at a time from one of about 15 subtelomeric VSG expression sites (ESs). For antigenic variation to work, not only must the vast VSG repertoire be kept silent in a genome that is mainly constitutively transcribed, but the frequency of VSG switching must be strictly controlled. Recently it has become clear that chromatin plays a key role in silencing inactive ESs, thereby ensuring monoallelic expression of VSG. We investigated the role of the linker histone H1 in chromatin organization and ES regulation in T. brucei. T. brucei histone H1 proteins have a different domain structure to H1 proteins in higher eukaryotes. However, we show that they play a key role in the maintenance of higher order chromatin structure in bloodstream form T. brucei as visualised by electron microscopy. In addition, depletion of histone H1 results in chromatin becoming generally more accessible to endonucleases in bloodstream but not in insect form T. brucei. The effect on chromatin following H1 knock-down in bloodstream form T. brucei is particularly evident at transcriptionally silent ES promoters, leading to 6-8 fold derepression of these promoters. T. brucei histone H1 therefore appears to be important for the maintenance of repressed chromatin in bloodstream form T. brucei. In particular H1 plays a role in downregulating silent ESs, arguing that H1-mediated chromatin functions in antigenic variation in T. brucei.


Conflict of interest statement

The authors have declared that no competing interests exist.

Figures

Figure 1
Figure 1. Histone H1 proteins in T. brucei.
A. Alignment of predicted histone H1 proteins from the genome sequence of T. brucei 927 . Green boxes indicate identical residues. Blue boxes indicate N-terminal serine/threonine residues, which may be targets for phosphorylation. Black bars indicate the peptides used for T. brucei histone H1 antibody production. B. Perchloric acid extraction of histone H1 proteins in T. brucei. Lanes show total T. brucei cell lysate (lane 1), supernatant after lysis by douncing (lane 2), and the fraction that has been extracted by perchloric acid treatment (lane 3). The left panel shows the Coomassie stained SDS-PAGE gel, and the right panel shows the Western blot of a Laemmli (glycine-based) SDS-PAGE gel reacted with an anti-histone H1 antibody. The sizes of marker proteins are indicated in kiloDaltons (kDa). C. Expression of histone H1 proteins in bloodstream form (BF) T. brucei HNI 221+ and procyclic form (PF) T. brucei 221BsrDsRed. Cells were lysed in SDS-PAGE sample buffer and proteins were resolved on Tris-tricine SDS-PAGE gels which were run for ∼5 hours for optimal resolution. The Western blot was probed with the anti-histone H1 antibody. An antibody against the La RNA binding protein is used as a loading control. Note that different protein standards were used for Tris-glycine and Tris-tricine SDS-PAGE gels, and that proteins migrate slightly differently using these different methods of electrophoresis. D. The T. brucei linker histone H1 has less affinity for chromatin than the core histone H3. BF T. brucei cells were lysed in 1% Triton X-100 in the presence of increasing amounts of NaCl. Pellet and supernatant (Sup.) fractions were analysed by Tris-tricine SDS-PAGE followed by Western blot analysis monitoring for histone H1, the core histone H3 and the La RNA binding protein. Total indicates total lysate. The concentration of NaCl (M) added during cell lysis is indicated above the relevant lane. The size of marker proteins in kiloDaltons is indicated.
Figure 2
Figure 2. Nuclear localization of histone H1 in T. brucei.
BF T. brucei HNI 221+ and PF T. brucei 221BsrDsRed cells were fixed and analysed by immunofluorescence microscopy using anti-histone H1 antibodies (αH1). The monoclonal L1C6 antibody was used to visualise the nucleolus, and a differential interference contrast (DIC) image is shown. Scale bar is 5 µm.
Figure 3
Figure 3. Distribution of histone H1 in the T. brucei genome.
A. Schematic of the BF T. brucei HNI 221+ cell line used for ChIP experiments indicated with a large red box. VSG expression sites (ESs) containing the hygromycin (Hyg) or neomycin (Neo) resistance genes, as well as the telomeric VSG221 (221) and VSGVO2 (VO2) genes are indicated. The ES promoters are indicated with flags, and transcription of the active VSG221 ES with an arrow. B. Representative slot blots of chromatin immunoprecipitation (ChIP) samples showing the presence of histone H3 or histone H1 on characteristic 50 bp repeat sequences found flanking ESs, or 177 bp repeats comprising the bulk of the T. brucei minichromosomes. Experiments were performed with no antibody (No ab) or pre-immune serum (Pre-imm.) from the rabbit used to produce the histone H1 antibody as negative controls (−). For each immunoprecipitated sample, 10% of the ChIP material was loaded on a slot blot and compared to 0.1% of the total input. C. Quantitation of material immunoprecipitated (% IP) using anti-histone H3 (H3) or anti-histone H1 (H1) in the slot blots shown in panel B. Bars show the mean of three experiments with standard deviation indicated with error bars. Two negative controls (−) were used: no antibody, or the pre-immune serum. D. Distribution of histone H1 within the genome of BF T. brucei as determined using qPCR analysis of ChIP material. The bars indicate the amount immunoprecipitated (% IP) using the anti-histone H1 antibody (H1) or pre-immune serum (Pre-imm.) as a control, with the standard deviation in three experiments indicated with error bars. Statistically significant (P<0.01) amounts of histone H1 were immunoprecipitated in all regions with the exception of the rDNA promoter, 18S rRNA, hygro and VSG221 genes (Supplemental Fig. S3). The RNA polymerase II (Pol II) transcribed regions analysed are the actin, γ-tubulin (γ-tub), RNA polymerase I large subunit (pol I), URA3, paraflagellar rod protein B (PFR) and spliced leader (SL) gene loci. The SL intergenic region (int.), promoter region (pro.), or the SL gene itself (SL) are indicated. The ribosomal DNA (rDNA) regions analysed include the rDNA intergenic region (int.), promoter (pro.) or the 18S rDNA gene (18S). The EP procyclin locus analysed includes the region upstream of the EP promoter (up.), the promoter (pro.), or the EP procyclin gene (EP). Higher levels of histone H1 were immunoprecipitated upstream of the promoters compared with at the promoter regions themselves, with the statistical significance indicated with asterisks (** indicates P<0.01, and **** indicates P<0.0001). ES sequences analysed include a region immediately upstream of the ES promoter (up.) as well as at the promoter itself (pro.). These primer pairs can be expected to recognise most if not all ESs. Sequences specific for the active VSG221 ES include the hygromycin resistance gene (Hygro) as well as VSG221. Sequences present in the silent VSGVO2 ES include the neomycin resistance gene (Neo) and VSGVO2. Note that the VSGVO2 primers detect both the telomeric ES located VSGVO2 gene, as well as the chromosome-internal copy of VSGVO2. VSG118 is found in the silent VSG basic copy arrays.
Figure 4
Figure 4. RNAi-mediated depletion of histone H1 proteins results in a moderate reduction in growth rates.
A. Growth curves of parental BF T. brucei or two independent BF T. brucei RYT3-H1 clones in the presence (+) or absence (−) of tetracycline to induce histone H1 RNAi. The mean of three experiments is shown with the standard deviation indicated with error bars. In each case, the cell number was multiplied by the dilution factor to obtain a value for cumulative cell growth. B. Western blot analysis of Tris-tricine gels showing knockdown of histone H1 in two independent BF T. brucei RYT3-H1 histone H1 RNAi clones compared with the parental (P) cell line. Histone H1 RNAi was induced with tetracycline for the time indicated in hours (h). BiP is shown as a loading control. C. Experiment similar to as shown in panel A. performed in PF T. brucei cells. D. A similar experiment as shown in panel B. performed using PF T. brucei cells. Histone H1 RNAi was induced with tetracycline for the time indicated in days (d).
Figure 5
Figure 5. Chromatin structure in the presence of reduced histone H1.
A. Schematic of the T. brucei BF RYT3-H1 cell line in which micrococcal nuclease (MNase) sensitivity experiments were performed after the induction of histone H1 RNAi. The large blue box indicates the BF T. brucei cell, with a blasticidin (Bla) gene integrated in the active VSGT3 ES (T3), and the puromycin (Pur) resistance gene and eGFP integrated immediately behind the promoter of the silent VSG221 ES. The expression site (ES) promoters are indicated with white flags, and ES transcription with an arrow. A construct allowing tetracycline inducible transcription of histone H1 RNAi (H1) from opposing T7 promoters (facing arrows) has also been introduced into these cells using a hygromycin resistance gene (Hyg) transcribed from an rDNA promoter (black flag). B. Parental (Par) BF T. brucei RYT3BSR cells and RYT3-H1 cells in which histone H1 had been knocked down by the induction of RNAi for 48 h (H1+48 h) were permeabilized and incubated with increasing concentrations of MNase (Lane 1 = 0.0625 units MNase, lane 2 = 0.125 units, lane 3 = 0.25 units and lane 4 = 0.5 units. Isolated DNA was visualized on ethidium bromide-stained agarose gels, and a characteristic ladder pattern was observed. Products corresponding to DNA that had been bound to mono-, di, or trinucleosomes, as well as undigested DNA (undig.) are indicated. DNA sizes are indicated in kilobases (kb) on the left. C. Sucrose gradient fractionation of MNase-digested chromatin from BF T. brucei RYT3BSR cells (Par). Chromatin in permeabilized cells was subjected to MNase treatment and then loaded onto a 5–30% sucrose step gradient (input). After centrifugation, fractions were removed, and DNA isolated. Fractions 11–24 are shown with top to bottom of the gradient indicated with an arrow. Fractions 1–10 contained very little DNA and are not shown. Fractions containing mono-, di-, di-/tri-, tri-/tetra-, and >tetranucleosomes are indicated with white bars. These fractions were used to create five pools of DNA which were used as templates for qPCR. D. BF T. brucei cells in which histone H1 RNAi had been induced for 48 hours. Chromatin in permeabilized cells was subsequently subjected to MNase treatment and was further analysed as described in panel C. E. Induction of histone H1 RNAi for 48 hours affects the distribution of various T. brucei genomic regions in the mononucleosomal fractions containing open chromatin. Results show qPCR analysis of fractionated, MNase-treated DNA. The amount of each target detected in the mononucleosome pool is plotted as a percentage of the total amount of target detected in all pools. Genomic regions analysed are as indicated in Fig. 3 panel D. The mean of three independent experiments is shown with error bars indicating standard deviation. Histone H1 knock-down resulted in a statistically significant increased distribution of various regions in the mononucleosomal fraction, with asterisks indicating statistical significance (*, P<0.05; **, P<0.01; ***, P<0.001).
Figure 6
Figure 6. Alteration of nuclear ultrastructure in bloodstream form T. brucei after depletion of histone H1.
The bloodstream form T. brucei RYT3BSR parental (Par) and the RYT3-H1C3 histone H1 RNAi cell line (H1C3) were cultured in the presence (48 h) or absence (0 h) of tetracycline (Tet) and analysed using transmission electron microscopy (TEM). Images show representative sections of nuclei that include the nucleolus (n) and the nuclear envelope (ne). The nuclei of parental T. brucei or RYT3-H1C3 lines before the induction of histone H1 RNAi have normal nuclear staining, where the nucleoplasm is divided into domains of greater electron density (black arrowheads), presumably corresponding to heterochromatin, interspersed with areas of lower density (white arrowheads), presumably corresponding to euchromatin. The nuclei of cells after the induction of histone H1 RNAi for 48 hours lack the dense chromatin domains. The scale bar represents 500 nm.
Figure 7
Figure 7. Derepression of silent ESs after knockdown of histone H1.
A. Schematic of the BF T. brucei RYT3-H1 line, which is as described in panel 5A. Histone H1 RNAi can be produced from two opposing tetracycline inducible T7 promoters. Transcription of the active VSGT3 ES is indicated with an arrow, and derepression of the silent eGFP gene located in the inactive VSG221 ES can be monitored by flow cytometry. B. Derepression of the silent VSG221 ES in BF T. brucei RYT3-H1 as measured by flow cytometry. Representative traces from the indicated time points are shown. Fold derepression was calculated by dividing the mean fluorescence value from the induced culture by the mean fluorescence value from a corresponding uninduced culture. The mean from three independent experiments is shown with the standard deviation indicated with error bars. C. Schematic of the PF T. brucei 221BsrDsRed-H1 cell line used to monitor derepression of a silent VSG ES after knockdown of histone H1. D. Derepression of a silent ES in PF T. brucei after the induction of histone H1 RNAi as monitored using the fluorescent DsRed protein. Representative flow cytometry traces are shown. Fold derepression was calculated as in B for three independent experiments with standard deviation indicated with error bars.
Figure 8
Figure 8. Strategy for determination of VSG switching frequencies after blocking histone H1 synthesis.
A. Diagram of the BF T. brucei 221pGFPhyTK-H1 cell line used for analysis of VSG switching after histone H1 knock-down. The large red box indicates a cell, with a construct containing the puromycin (Pur) resistance gene and eGFP integrated immediately behind the active VSG221 ES promoter (indicated with a flag). A construct containing a fusion protein for hygromycin resistance and thymidine kinase (HYGTK) activity is integrated at the telomeric end of the ES between characteristic 70 bp repeat sequences (70 bp) and the telomeric VSG221 gene. A silent ES with an unknown VSG (X) is indicated below, as well as chromosome internal silent VSGs (Y) located in tandem arrays. A construct allowing transcription of histone H1 RNAi (H1) from opposing T7 promoters (arrows) as well as a phleomycin (Phleo) gene transcribed from an rDNA promoter (black flag) has also been introduced. B. Schematic of VSG switching mechanisms detectable in our assay, adapted from . Switching the active VSG can be mediated through a VSG gene conversion (GC), telomere exchange (XO), or in situ activation of another ES (in situ). In addition, VSG switch events resulting in loss of the VSG221 ES by either gene conversion (ES GC) or a deletion event after an in situ switch (in situ+ES del) were identified. Each type of VSG switch event, in addition to mutations in the TK gene itself (not shown), result in resistance to ganciclovir (GCV). Presence of the single copy VSG221 gene is indicated below (DNA). In addition, expression of the GFP or VSG221 protein are indicated. The schematic is labeled as indicated in panel A.
Figure 9
Figure 9. Depletion of histone H1 results in an increase in VSG switching.
A. The frequency of generation of ganciclovir resistant (GCVR) trypanosomes per generation (GCVR tryps/gen) in parental (Par) T. brucei and 221pGFPhyTK-H1 cells in the presence of histone H1 RNAi for the time indicated in hours (h). Bars indicate the mean of independent experiments [parental n = 3; H1 RNAi cells (0 h and 48 h histone H1 RNAi), n = 5]. The standard deviation is indicated with error bars. A higher rate of generation of GCVR clones as a measure for VSG switching was observed in uninduced T. brucei 221pGFPhyTK-H1 cells (containing the histone H1 RNAi construct) compared with parental cells (statistical significance **, P<0.01). However, there was a statistically significant increase in this frequency after the induction of histone H1 RNAi for 48 hours (***, P<0.001). B. Mechanism of VSG switching in clones from seven independent cultures after the induction of histone H1 RNAi for 48 hours (n = 64) (purple bars) or in four independent cultures generated in the absence of histone H1 RNAi (n = 33) (blue bars). The genotypes and phenotypes of the clones were determined using microscopy and PCR, allowing determination of the VSG switching mechanism used. The percentage of clones that had switched using each mechanism is plotted. VSG switch mechanisms are as indicated in Figure 8, as well as cells which appeared to have mutated the TK gene (TK mut.) as determined by their resistance to GCV and continued expression of VSG221. C. Frequency of generation of GCVR clones per generation (freq/gen) in parental (Par) and 221pGFPhyTK-H1 cells grown in the absence (0 h) or presence of histone H1 RNAi for 48 hours (48 h). These experiments were conducted in the presence of puromycin to select for DNA rearrangements in the vicinity of the telomeric VSG. Bars indicate the mean of three independent experiments with standard deviation indicated with error bars. As shown in panel A., cells containing the H1 RNAi construct show a statistically significant increase in the frequency of ganciclovir resistant cells (statistical significance *, P = 0.024). This frequency does not further increase after depletion of histone H1 for 48 hours (statistical significance of increase compared with parental *, P = 0.014). D. Increased VSG switching mediated by gene conversion (GC) in cells depleted for histone H1. VSG switching was monitored in T. brucei 221pGFPhyTK-H1 cells in the absence (0 h) or presence of H1 RNAi for 48 hours. VSG switching mechanisms were determined in clones derived from at least three independent cultures for each experiment. All GCVR clones were generated in the presence of puromycin to select for VSG switches mediated by DNA rearrangements at the telomere of the active ES. VSG switching mechanisms were determined using immunofluorescence microscopy and PCR as in panel B. Using parental cells (Par) or uninduced histone H1 RNAi cells (0 h) ∼90% of the obtained clones (Par n = 19; H1 RNAi 0 h n = 21) continued to express VSG221, indicating that they are TK mutants (TK mut.). However, when histone H1 RNAi had been induced for 48 hours, less than half of the generated clones were TK mutants, and ∼33% had switched through VSG gene conversion (VSG GC). Clones that had switched through telomere exchange (Telo XO) were also observed using this assay.
Figure 10
Figure 10. Histone H1 depletion does not affect recombination frequency at the Pol II-transcribed URA3 locus.
A. The experimental assay for gene conversion is as described in , . One allele of the URA3 gene (violet box) is replaced by a hygromycin resistance/thymidine kinase fusion gene (HYGTK) (blue and orange boxes). Gene conversion at this locus either results in cells which have two copies of the URA3 gene and are sensitive to FOA (FOAS) and resistant to ganciclovir (GCVR). Alternatively, the cells have two copies of the HYGTK gene and are FOA resistant (FOAR) and sensitive to ganciclovir (GCVS). B. Frequency of gene conversion at the URA3 locus in parental (Par) cells or those containing the histone H1 RNAi construct. Cells were removed from hygromycin selection for 48 hours, and one culture of H1 RNAi cells had histone H1 RNAi induced for 48 hours. Cells were then plated in the presence of either GCV or FOA and the number of positive wells were scored after eight days. The value shown is the sum frequency of FOAR and GCVR clones, which can be considered to have undergone gene conversion (GC), divided by the number of generations undergone by each cell line. Bars show the mean of three independent experiments with standard deviation indicated with error bars. The differences between the samples were not statistically significant.

Similar articles

Cited by

References

    1. Taylor JE, Rudenko G (2006) Switching trypanosome coats: what's in the wardrobe? Trends Genet 22: 614–620. - PubMed
    1. Horn D, McCulloch R (2010) Molecular mechanisms underlying the control of antigenic variation in African trypanosomes. Curr Opin Microbiol 13: 700–705. - PMC - PubMed
    1. Berriman M, Ghedin E, Hertz-Fowler C, Blandin G, Renauld H, et al. (2005) The genome of the African trypanosome Trypanosoma brucei. Science 309: 416–422. - PubMed
    1. Marcello L, Barry JD (2007) Analysis of the VSG gene silent archive in Trypanosoma brucei reveals that mosaic gene expression is prominent in antigenic variation and is favored by archive substructure. Genome Res 17: 1344–1352. - PMC - PubMed
    1. Hutchinson OC, Picozzi K, Jones NG, Mott H, Sharma R, et al. (2007) Variant Surface Glycoprotein gene repertoires in Trypanosoma brucei have diverged to become strain-specific. BMC Genomics 8: 234. - PMC - PubMed

Publication types

MeSH terms