. 2012;8(11):e1002992.
doi: 10.1371/journal.pgen.1002992. Epub 2012 Nov 1.

Population genomic scan for candidate signatures of balancing selection to guide antigen characterization in malaria parasites

Affiliations

Population genomic scan for candidate signatures of balancing selection to guide antigen characterization in malaria parasites

Alfred Amambua-Ngwa et al. PLoS Genet. 2012.

Abstract

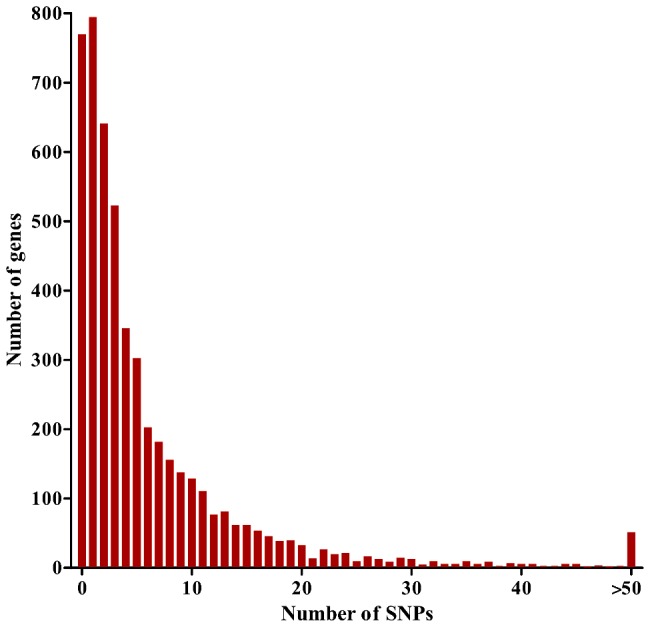
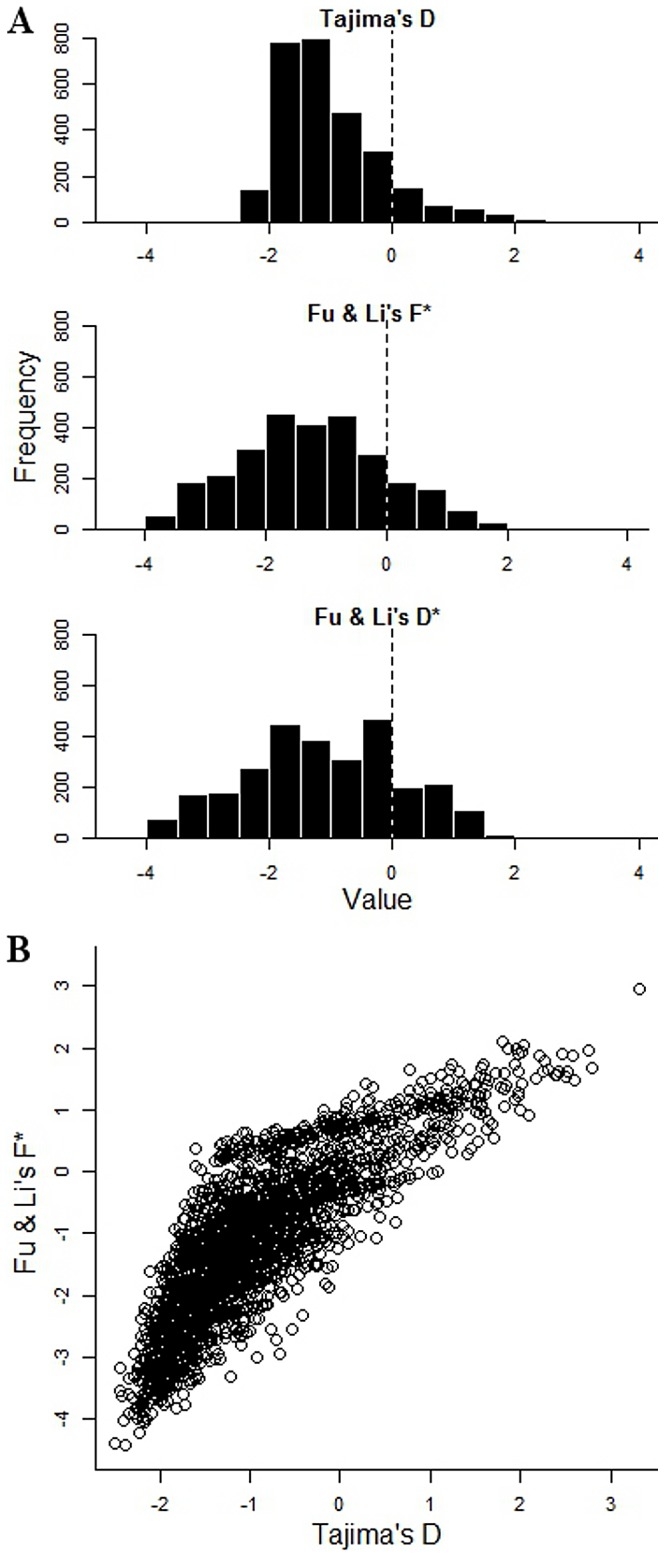
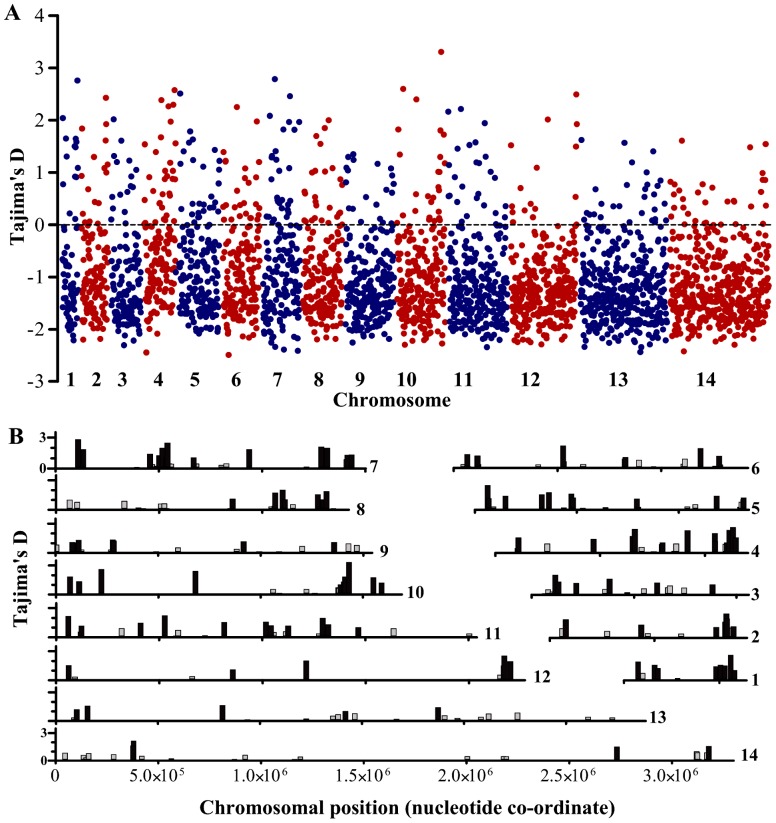
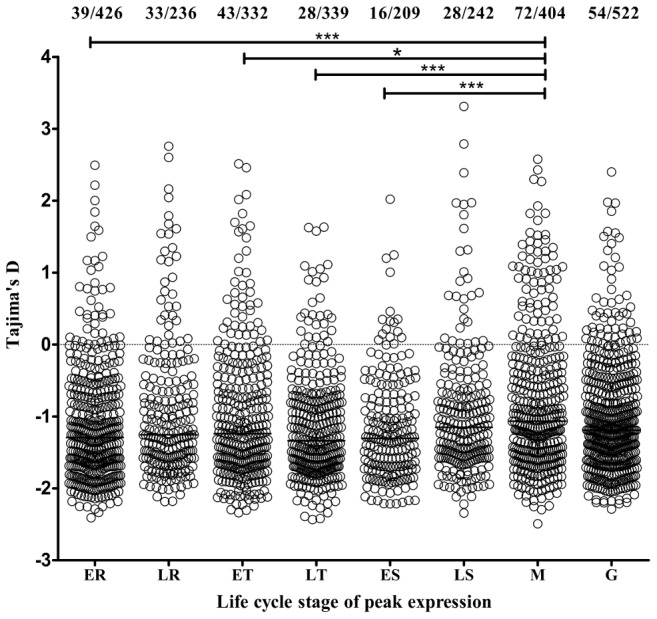
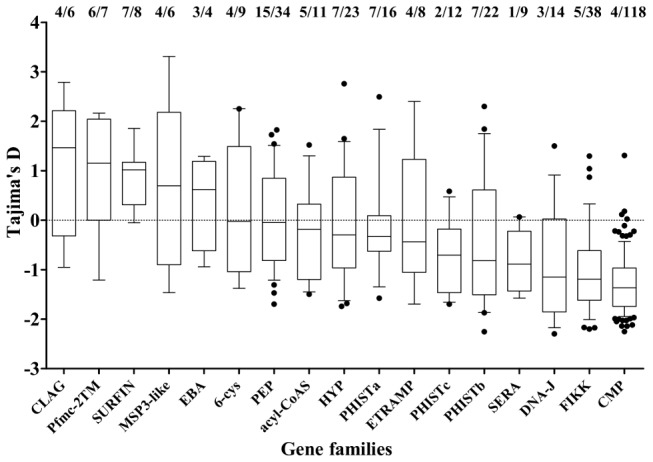
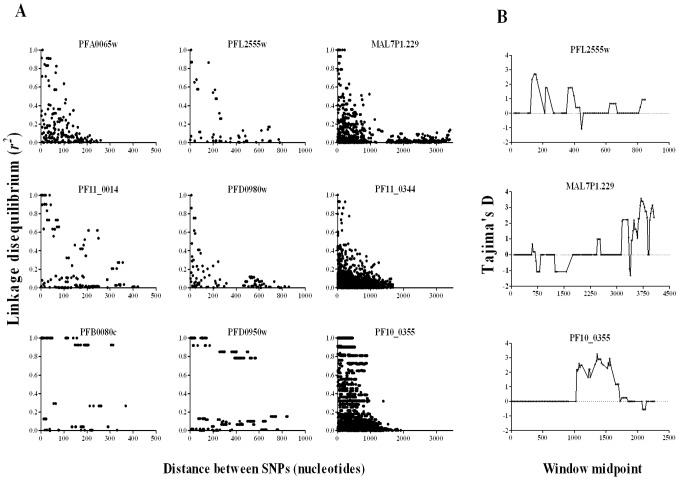
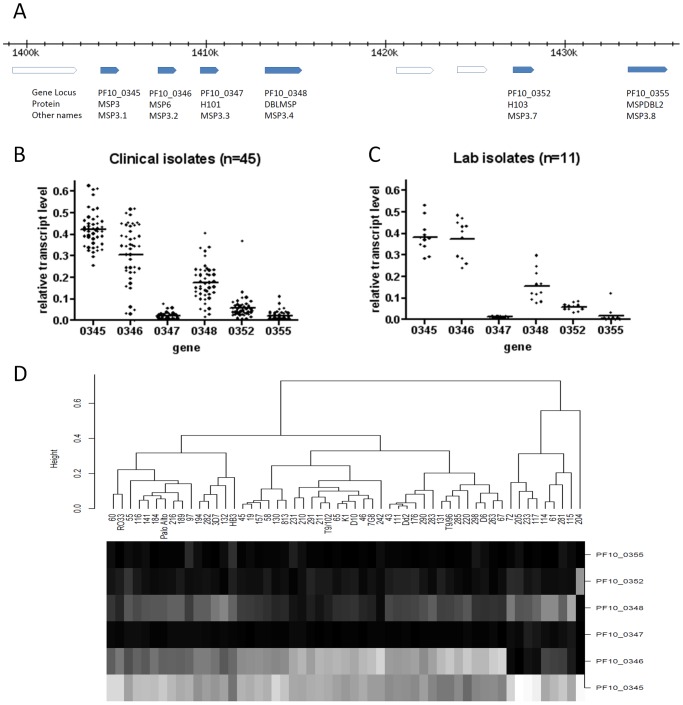
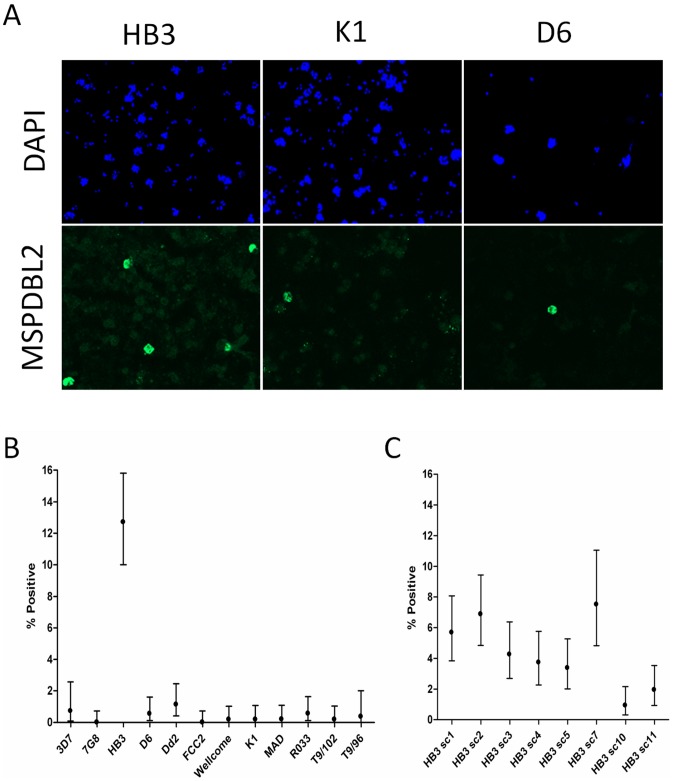
Acquired immunity in vertebrates maintains polymorphisms in endemic pathogens, leading to identifiable signatures of balancing selection. To comprehensively survey for genes under such selection in the human malaria parasite Plasmodium falciparum, we generated paired-end short-read sequences of parasites in clinical isolates from an endemic Gambian population, which were mapped to the 3D7 strain reference genome to yield high-quality genome-wide coding sequence data for 65 isolates. A minority of genes did not map reliably, including the hypervariable var, rifin, and stevor families, but 5,056 genes (90.9% of all in the genome) had >70% sequence coverage with minimum read depth of 5 for at least 50 isolates, of which 2,853 genes contained 3 or more single nucleotide polymorphisms (SNPs) for analysis of polymorphic site frequency spectra. Against an overall background of negatively skewed frequencies, as expected from historical population expansion combined with purifying selection, the outlying minority of genes with signatures indicating exceptionally intermediate frequencies were identified. Comparing genes with different stage-specificity, such signatures were most common in those with peak expression at the merozoite stage that invades erythrocytes. Members of clag, PfMC-2TM, surfin, and msp3-like gene families were highly represented, the strongest signature being in the msp3-like gene PF10_0355. Analysis of msp3-like transcripts in 45 clinical and 11 laboratory adapted isolates grown to merozoite-containing schizont stages revealed surprisingly low expression of PF10_0355. In diverse clonal parasite lines the protein product was expressed in a minority of mature schizonts (<1% in most lines and ∼10% in clone HB3), and eight sub-clones of HB3 cultured separately had an intermediate spectrum of positive frequencies (0.9 to 7.5%), indicating phase variable expression of this polymorphic antigen. This and other identified targets of balancing selection are now prioritized for functional study.


Conflict of interest statement

The authors have declared that no competing interests exist.

Figures

Figure 1
Figure 1. Distribution of numbers of SNPs per gene for 5,056 P. falciparum genes analyzed with a population sample of 65 Gambian clinical isolates.
Figure 2
Figure 2. Tajima's and Fu & Li's summary indices of nucleotide site frequency spectrum for each of 2,853 P. falciparum genes with 3 or more SNPs in the Gambian population.
A. Frequency distribution histograms for the individual gene values for Tajima's D, Fu & Li's F* and Fu & Li's D* respectively. B. Two-dimensional plot of Tajima's D and Fu & Li's F* values for each of the 2853 genes (r = 0.67; correlation between Fu & Li's F* and D* indices is stronger, r = 0.96; correlation between Tajima's D and Fu & Li's D* is less, r = 0.50; P<0.001 for all correlations). Those in the top right tail of the distribution with high indices of both are considered further as genes with candidate signatures of balancing selection.
Figure 3
Figure 3. Distribution of Tajima's D values across all 14 chromosomes for each of the 2,853 P. falciparum genes with 3 or more SNPs in the Gambian population.
A. All values for individual genes are plotted as individual points positioned according to the order of the genes along each of the chromosomes. B. Chromosomal locations of each of the genes with positive Tajima's D values (genes with values between zero and 1.0 are shown in grey, those with values >1.0 in black).
Figure 4
Figure 4. Genes with estimated peak expression at the merozoite stage have highest Tajima's D values overall.
Assignment of peak stage transcript expression for 2710 genes in data from microarray studies used an expression time series query implemented by PlasmoDB , and are plotted against the polymorphism data from the present study. The points show the values for individual genes (and horizontal bars the medians of all genes) with estimated peak expression at each stage (ER, early ring; LR, late ring; ET, early trophozoite; LT, late trophozoite; ES, early schizont; LS, late schizont; M, merozoite; G, gametocyte). The proportions of genes with values above zero are shown at the top (this is highest for merozoite-stage genes, with 72/404 or 17.8%, p<0.0001 compared with all other genes). Asterisks indicate p values for Mann-Whitney tests on the comparisons of distributions between pairs of stages (* p<0.01, *** p<0.0001).
Figure 5
Figure 5. Distribution of Tajima's D values in members of different gene families and groups of genes defined by expression location.
For each, plots show the mean (mid-line), one standard deviation (boxes), and 2 standard deviations (whiskers) with any individual outlier genes as points. The proportions of genes with values above zero and the numbers of genes analysed in each gene family are shown above the plot.
Figure 6
Figure 6. Mapping signatures to particular regions within genes.
A. Plots of linkage disequilibrium (r 2) with distance between polymorphic nucleotides within genes each containing 10 or more SNPs. Nine genes are illustrated: left hand column shows genes with data on SNPs covering <500 bp, middle column 500–1000 bp, and right hand column >1000 bp, each column plotted with a different x-axis scale. Decline of LD with distance is evident in most genes, although the bottom plots show examples with some extended LD over most of the sequence analysed. B. Sliding window analysis identifies regions of genes with candidate signatures of balancing selection: top plot shows a PHISTa gene (PFL2555w) with high Tajima's D values in the 5′-region; middle plot shows the strongest signature on a clag-like gene (MAL7P1.229) is in the 3′-region; bottom plot for PF10_0355 shows the signature in the middle of the sequence. Window size of 100 bp was applied with step size of 25 bp.
Figure 7
Figure 7. Transcript profiles of the six msp3-like genes in P. falciparum clinical and laboratory isolates grown to schizont stages.
(A) Genomic loci of the six msp3-like genes on parasite chromosome 10 (nomenclature and map is based on 3D7 genome sequence version 2.1). Quantitative RT-PCR was based on non-polymorphic sequences (oligonucleotide primers and probes are given in Table S4). (B) Variation in relative transcript levels for the six msp3-like genes among 45 Gambian clinical isolates. Relative transcript levels for each gene in each isolate are normalized as a proportion of the sum for all six genes within the isolate. (C) Variation in transcript levels of the genes among 11 diverse laboratory-adapted cultured isolates. (D) Cluster analysis of expression profiles in the 45 clinical isolates and 11 laboratory-adapted isolates. Laboratory isolates are interspersed with the clinical isolates throughout, except for a divergent cluster of only clinical isolates on the right of the figure expressing little or no transcript of the msp6 gene PF10_0346 (including one isolate that abundantly expressed the h103/msp11 gene PF10_0352).
Figure 8
Figure 8. Immunofluorescent FITC labelling of the MSPDBL2 antigen.
(A) Immunofluorescent FITC (green) labelling of the MSPDBL2 antigen (product of PF10_0355) in a minority of schizonts with individual microscopic fields illustrated for three parasite isolates (HB3, K1 and D6), alongside staining of parasite DNA by DAPI (blue) for the same fields. Parasite immunofluorescence shows reactivity with 1/500 diluted mouse antiserum raised to a recombinant protein representing the N-terminal of MSPDBL2. (B) Proportions (with 95% CI) of schizonts positive for DBLMSP2 in 12 cultured isolates each with a different single parasite genotype. (C) Proportions of schizonts positive for DBLMSP2 in eight sub-clones of clone HB3. Exact numbers counted are shown in Table S3.

References

    1. Akey JM (2009) Constructing genomic maps of positive selection in humans: where do we go from here? Genome Res 19: 711–722. - PMC - PubMed
    1. Oleksyk TK, Smith MW, O'Brien SJ (2010) Genome-wide scans for footprints of natural selection. Philos Trans R Soc Lond B Biol Sci 365: 185–205. - PMC - PubMed
    1. Grossman SR, Shylakhter I, Karlsson EK, Byrne EH, Morales S, et al. (2010) A composite of multiple signals distinguishes causal variants in regions of positive selection. Science 327: 883–886. - PubMed
    1. Wilson DJ, Hernandez RD, Andolfatto P, Przeworski M (2011) A population genetics-phylogenetics approach to inferring natural selection in coding sequences. PLoS Genet 7: e1002395 doi:10.1371/journal.pgen.1002395. - PMC - PubMed
    1. Zhai W, Nielsen R, Slatkin M (2009) An investigation of the statistical power of neutrality tests based on comparative and population genetic data. Mol Biol Evol 26: 273–283. - PMC - PubMed

Publication types