. 2012;8(11):e1003034.
doi: 10.1371/journal.pgen.1003034. Epub 2012 Nov 1.

A dominantly acting murine allele of Mcm4 causes chromosomal abnormalities and promotes tumorigenesis

Affiliations

A dominantly acting murine allele of Mcm4 causes chromosomal abnormalities and promotes tumorigenesis

Bruce N Bagley et al. PLoS Genet. 2012.

Abstract

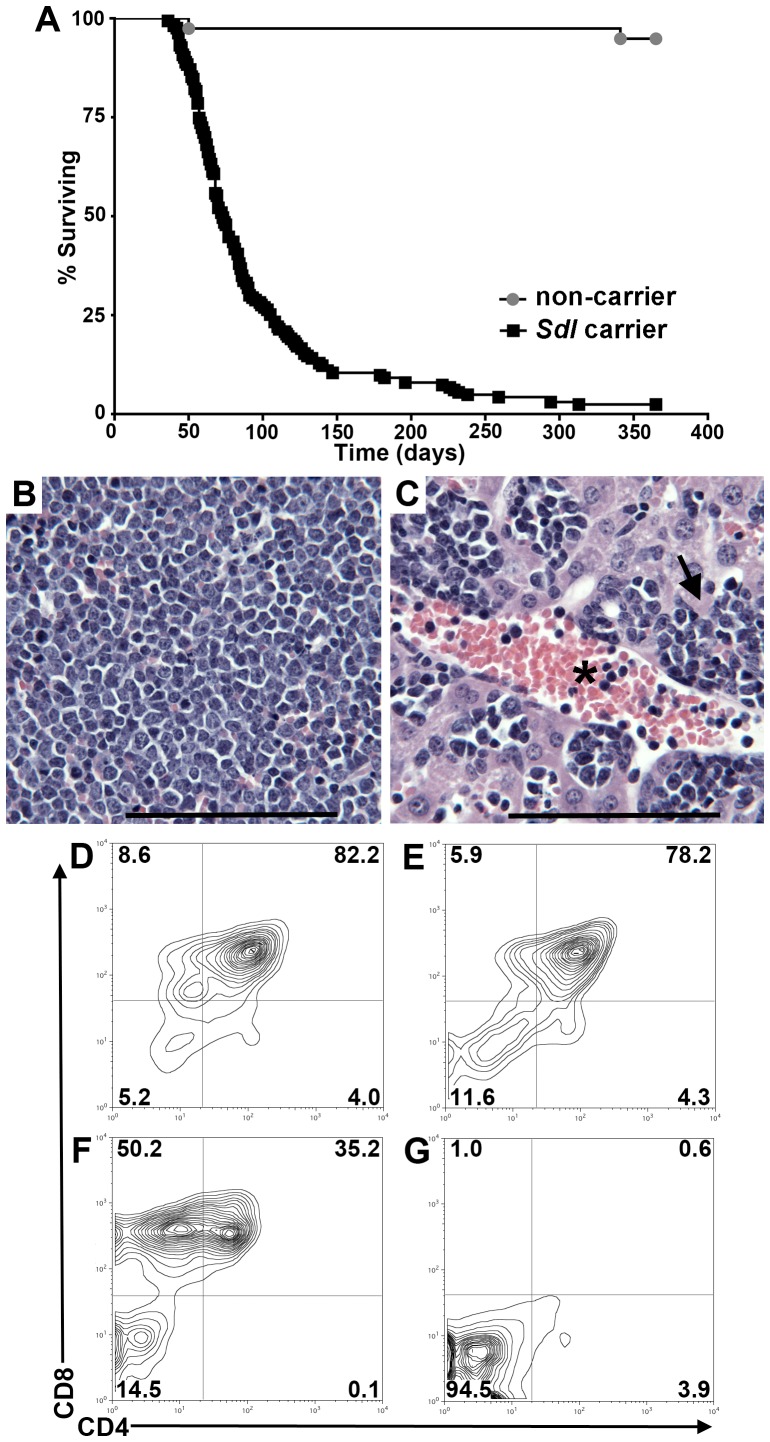
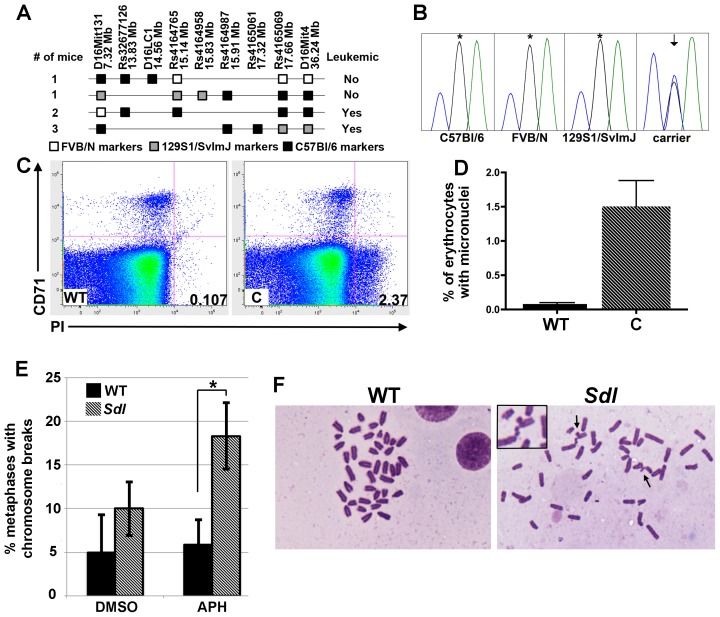
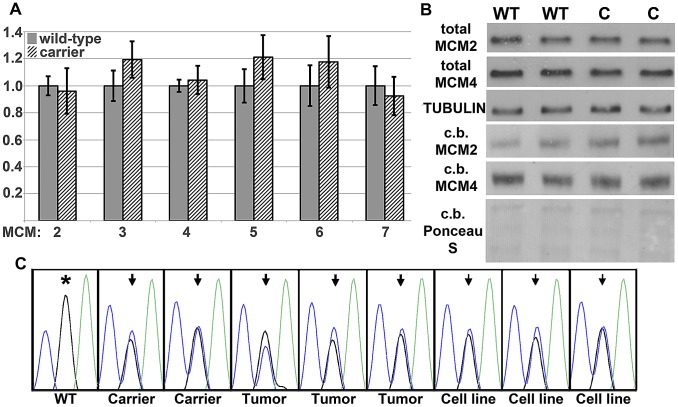
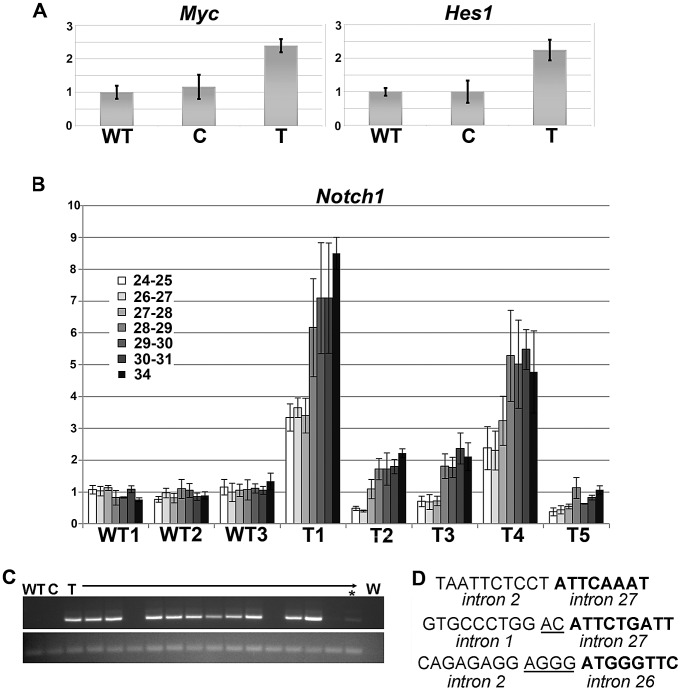
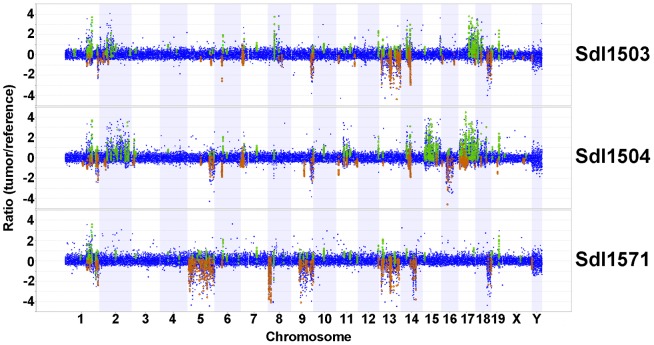
Here we report the isolation of a murine model for heritable T cell lymphoblastic leukemia/lymphoma (T-ALL) called Spontaneous dominant leukemia (Sdl). Sdl heterozygous mice develop disease with a short latency and high penetrance, while mice homozygous for the mutation die early during embryonic development. Sdl mice exhibit an increase in the frequency of micronucleated reticulocytes, and T-ALLs from Sdl mice harbor small amplifications and deletions, including activating deletions at the Notch1 locus. Using exome sequencing it was determined that Sdl mice harbor a spontaneously acquired mutation in Mcm4 (Mcm4(D573H)). MCM4 is part of the heterohexameric complex of MCM2-7 that is important for licensing of DNA origins prior to S phase and also serves as the core of the replicative helicase that unwinds DNA at replication forks. Previous studies in murine models have discovered that genetic reductions of MCM complex levels promote tumor formation by causing genomic instability. However, Sdl mice possess normal levels of Mcms, and there is no evidence for loss-of-heterozygosity at the Mcm4 locus in Sdl leukemias. Studies in Saccharomyces cerevisiae indicate that the Sdl mutation produces a biologically inactive helicase. Together, these data support a model in which chromosomal abnormalities in Sdl mice result from the ability of MCM4(D573H) to incorporate into MCM complexes and render them inactive. Our studies indicate that dominantly acting alleles of MCMs can be compatible with viability but have dramatic oncogenic consequences by causing chromosomal abnormalities.


Conflict of interest statement

The authors have declared that no competing interests exist.

Figures

Figure 1
Figure 1. The Sdl mutation results in highly penetrant disease, which is primarily early-onset T-ALL.
A) Kaplan-Meier curve of time to morbidity for Sdl mice. Known carriers of Sdl (harboring a C57Bl/6 haplotype at D16MIT131 and D16MIT4 on proximal Chr 16) are denoted by black squares, while sibling non-carriers are denoted by grey circles. p<0.0001. B–C) H&E staining showing that neoplastic cells fill hematopoietic organs (B) and also infiltrate the blood (vessel indicated with an asterisk) and the parenchyma (arrow) of other organs such as liver (C). B and C are 40× magnification, scale bar = 50 µM. D–G) Examples of flow cytometry analysis of lymphomas from four moribund Sdl mice. A full summary of flow-cytometry data is available as Table S1. Mice depicted in D–F succumbed to early onset-disease that is phenotypically T-ALL. Within these animals, there is evidence of both CD4/8 double positive (DP) disease as well as CD8 single positive (SP) disease. The mouse in G became moribund with late-onset disease (354 days of age) and the tumor cells do not express most T cell antigens (see also Table S1).
Figure 2
Figure 2. Sdl mice harbor a mutation in Mcm4 that causes chromosomal abnormalities.
A) Recombination events in Chr 16 that define the Sdl interval. Only the relevant Sdl haplotype is shown. White squares: FVB/N alleles, Grey squares: 129S1/SvImJ alleles, Black squares: C57Bl/6 alleles. The Sdl mutation must map within regions harboring C57Bl/6 alleles in leukemic mice, but must be excluded from regions harboring C57Bl/6 alleles in non-leukemic mice. Analyzing two non-leukemic mice indicates that the Sdl mutation likely lies distal to 14.56 and proximal to 15.91. The two non-leukemic mice were bred and non-carrier status was verified. B) Sanger sequencing traces demonstrating the G to C substitution present in all confirmed Sdl carriers but absent from all wild-type strains examined. Arrow indicates dual G/C peak, asterisk indicates wild-type G peak. C) Sdl mice harbor increased numbers of spontaneous micronuclei. Example flow cytometry plots for wild-type (WT) and Sdl carrier (C) mice for micronuclei detection. Micronucleated normochromatic erythrocytes are propidium iodide (PI) positive but CD71 negative (lower right quadrant) and are expressed as a percentage of total erythrocytes. D) Quantification of micronuclei for sex and aged-matched wild-type (solid bar, WT) (n = 8) and Sdl carriers (striped bar, C) (n = 5). Mean for wild-type = 0.0815 and for Sdl carriers = 1.503 (p<0.0005). Error bars represent standard deviation. E) Sdl (striped bars) and wild-type (solid bars) MEFs were treated with Dimethyl sulfoxide (DMSO) as vehicle control or 0.15 µM aphidicolin (APH) and the percent of metaphases with chromosome breaks determined. No statistically significant difference between Sdl and wild-type was observed when cells were treated with vehicle only (p>0.26, t-test). In the presence of APH, Sdl MEFs did harbor more chromosome breaks (average 18.3%) than wild-type MEFs (average 5.8%) (p<.02, t-test, asterisk). Error bars represent standard deviation. F) Example metaphase spreads without chromosome breaks (WT, APH treated) and with chromosome breaks (Sdl, APH treated). Arrows indicate chromosome breaks, one example shown as inset.
Figure 3
Figure 3. Mcm4D573H acts in a dominant manner to promote tumorigenesis.
WT = wild-type C = carrier. A) Mcm2–7 transcript levels are not decreased in Sdl carrier thymuses (striped bars) compared to wild-type thymuses (solid bars) as analyzed by qRT-PCR. Values for wild-type thymus are normalized to 1. N = 3 for wild-type, 6 for carrier. Error bars represent standard deviation. There is a trend toward increased expression of Mcm3 and Mcm5 in Sdl carrier thymuses compared to wild-type thymuses (p = 0.07 and 0.09, respectively); all other p values >.2. B) Western analysis on total thymus protein extract as well as purified chromatin bound (c.b.) fractions indicate that Sdl carrier thymuses harbor similar levels of MCM2 and 4 proteins as do wild-type thymuses. TUBULIN and Ponceau S membrane staining were utilized to demonstrate equal loading for whole cell lysates and chromatin bound fractions, respectively. C) Sanger sequencing traces of RT-PCR products demonstrate that both wild-type (G) and mutant (C) Mcm4 alleles are expressed in Sdl tumors and tumor-derived cell lines. RT-PCR products from 21-day-old wild-type and Sdl carrier thymuses are shown for reference. Arrow indicates dual G/C peak, asterisk indicates wild-type G peak.
Figure 4
Figure 4. S. cerevisiae mcm4 engineered with the Sdl mutation at the equivalent residue (D632H) generates a non-biologically active helicase.
A) Examples of genetic complementation tests of a mcm4 deletion haploid strain in which viability is maintained by an URA3-mcm4 plasmid. This strain was transformed with TRP1 plasmids expressing mcm4Sdl mutation (S), mcm4 wild-type (W) or empty TRP1 vector (V). A) Growth on permissive conditions (−TRP) demonstrates that all colonies analyzed harbor the expected TRP1 plasmids. B) Growth under restrictive conditions (−TRP+ FOA) occurs only if viability can be maintained by the allele on the TRP1 plasmid. All mcm4 wild-type colonies grew under restrictive conditions and empty vector colonies do not, as expected. A fraction of colonies expressing mcm4Sdl mutation grew under restrictive conditions. C) A restriction fragment polymorphism was utilized to distinguish mcm4Sdl from wild-type (WT) mcm4 sequences in the yeast strains described above. One mcm4 wild-type (W) colony and 10 mcm4Sdl (S) colonies are shown. All freshly isolated mcm4Sdl colonies grown under permissive conditions (−URA −TRP) harbor both mcm4Sdl and mcm4 wild-type sequences due to the presence of TRP1-mcm4Sdl and URA3-mcm4 plasmids. All mcm4Sdl colonies that grew under restrictive conditions lost mcm4Sdl sequences, indicating that growth occurred due to a reversion or gene conversion event involving mcm4Sdl sequences on the TRP1 plasmid and not due to the ability of mcm4Sdl to complement the mcm4 genomic deletion.
Figure 5
Figure 5. Notch1 activation due to intragenic deletions occurs during leukemogenesis in Sdl mice.
WT = wild-type, C = carrier Sdl thymus, T = tumor. Error bars represent standard deviation. For all qRT-PCR data, expression in wild-type thymus was normalized to 1. A) qRT-PCR detects higher levels of expression of the Notch1 targets Myc and Hes1 in Sdl thymic tumors compared to wild-type thymus or carrier thymus. N = 3 per group. p<0.001 for comparisons of wild-type thymus or carrier thymus to tumors. B) qRT-PCR results for querying expression levels of individual Notch1 exon/exon boundaries indicated as well as exon 34 for three wild-type thymuses and five Sdl tumors. All q-PCRs were performed in triplicate. C) RT-PCR using a forward primer in exon 1 and a reverse primer in exon 30 detects abnormal Notch1 transcripts in 11 of 15 tumors (T) from Sdl mice but not in wild-type thymus (WT) or thymus from Sdl carrier mice (C) (top panel). An additional tumor (asterisk) was weakly positive. A no-RNA control (water, W) is also shown. RT-PCR for Gapdh was used to verify the presence of cDNA (bottom panel). D) Sequences surrounding three genomic breakpoints in Notch1 cloned from Sdl tumors. 5′ introns are in regular font, 3′ introns are in bold font. Microhomology is underlined.
Figure 6
Figure 6. Array CGH profiles of thymic tumors from three Sdl mice.
Probes with copy number gains and losses in tumors compared to reference are shown in green and red, respectively.

References

    1. Bochman ML, Schwacha A (2009) The Mcm complex: unwinding the mechanism of a replicative helicase. Microbiol Mol Biol Rev 73: 652–683. - PMC - PubMed
    1. Allen C, Ashley AK, Hromas R, Nickoloff JA (2011) More forks on the road to replication stress recovery. Journal of molecular cell biology 3: 4–12. - PMC - PubMed
    1. Shima N, Alcaraz A, Liachko I, Buske TR, Andrews CA, et al. (2007) A viable allele of Mcm4 causes chromosome instability and mammary adenocarcinomas in mice. Nature genetics 39: 93–98. - PubMed
    1. Chuang CH, Wallace MD, Abratte C, Southard T, Schimenti JC (2010) Incremental genetic perturbations to MCM2–7 expression and subcellular distribution reveal exquisite sensitivity of mice to DNA replication stress. PLoS Genet 6. - PMC - PubMed
    1. Pruitt SC, Bailey KJ, Freeland A (2007) Reduced Mcm2 expression results in severe stem/progenitor cell deficiency and cancer. Stem Cells 25: 3121–3132. - PubMed

Publication types

MeSH terms