. 2012 Nov 6:6:74.
doi: 10.3389/fnbeh.2012.00074. eCollection 2012.

Whisker encoding of mechanical events during active tactile exploration

Affiliations

Whisker encoding of mechanical events during active tactile exploration

Yves Boubenec et al. Front Behav Neurosci. .

Abstract

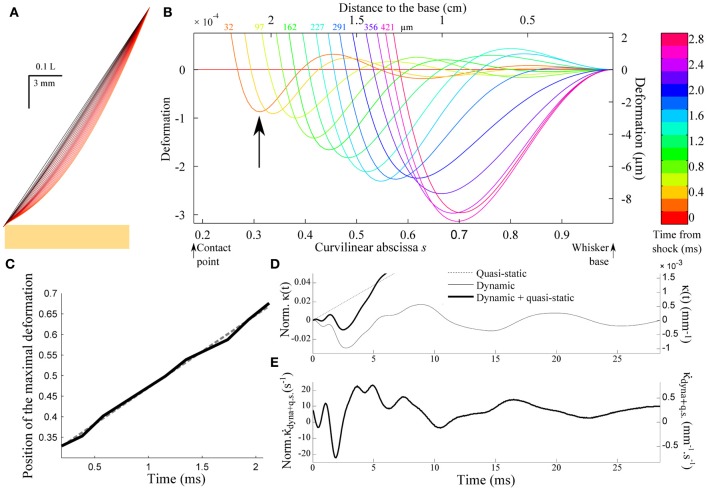
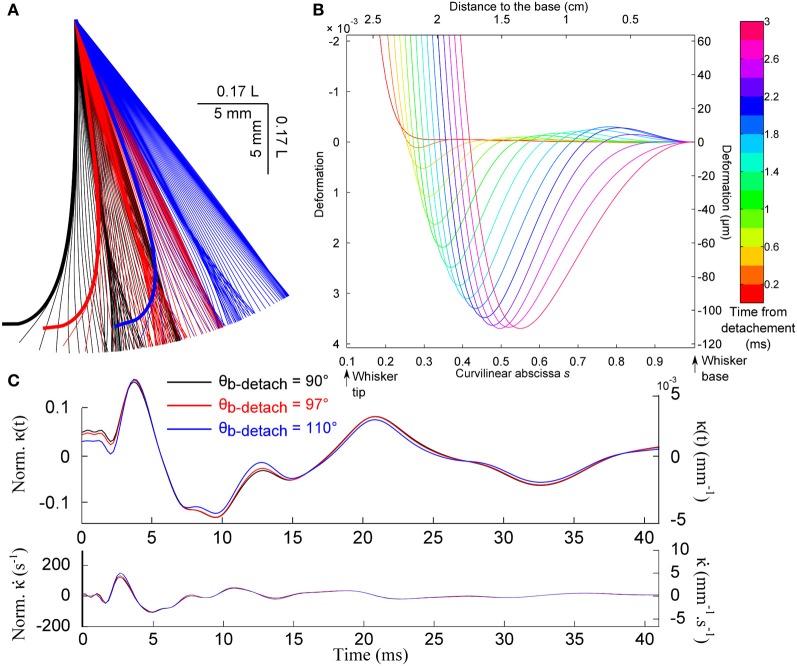
Rats use their whiskers to extract a wealth of information about their immediate environment, such as the shape, position or texture of an object. The information is conveyed to mechanoreceptors located within the whisker follicle in the form of a sequence of whisker deflections induced by the whisker/object contact interaction. How the whiskers filter and shape the mechanical information and effectively participate in the coding of tactile features remains an open question to date. In the present article, a biomechanical model was developed that provides predictions of the whisker dynamics during active tactile exploration, amenable to quantitative experimental comparison. This model is based on a decomposition of the whisker profile into a slow, quasi-static sequence and rapid resonant small-scale vibrations. It was applied to the typical situation of a rat actively whisking across a solid object. Having derived the quasi-static sequence of whisker deformation, the resonant properties of the whisker were analyzed, taking into account the boundary conditions imposed by the whisker/surface contact. We then focused on two elementary mechanical events that are expected to trigger significant neural responses, namely (1) the whisker/object first contact and (2) the whisker detachment from the object. Both events were found to trigger a deflection wave propagating upward to the mystacial pad at constant velocity of ≈3-5 m/s. This yielded a characteristic mechanical signature at the whisker base, in the form of a large peak of negative curvature occurring ≈4 ms after the event has been triggered. The dependence in amplitude and lag of this mechanical signal with the main contextual parameters (such as radial or angular distance) was investigated. The model was validated experimentally by comparing its predictions to high-speed video recordings of shock-induced whisker deflections performed on anesthetized rats. The consequences of these results on possible tactile encoding schemes are briefly discussed.

Keywords: exploration; rat; resonance; tactile; vibration; vibrissae; whiskers; whisking.


Figures

Figure 1
Figure 1
Schematic view of a tactile exploration task.
Figure 2
Figure 2
Geometry of the whisker in contact. (A) Whisker as a truncated cone. (B) The whisker is submitted to a localized frictional contact imposed at s = ε and oriented at a friction angle ϕ with respect to the direction normal to the surface. Notice that the whisker is locally tangent to the surface. The whisker rotates at constant rate around a fixed point that corresponds to the whisker base (s = 1).
Figure 3
Figure 3
Quasi-static evolution of a whisker rotating across a rectangular object. (A1) Quasi-static sequence of whisker deformation for a friction coefficient μ = 0.4 and a radial distance D = 0.83 L. Different colors correspond to distinct phases: the whisker rotates in air (black), rolls over the obstacle edge (red), slides over the flat surface (blue) and, after detachment, rotates in air (green). The color code is conserved throughout the graphs. (A2) Evolution of the contact point location ε as a function of the base angle θbb step = 1.7°). (A3) Evolution of the whisker base moment κ(t) and (A4) its time derivative κ˙(t). (B1–B3) Same data shown for four different values of the friction coefficient μ. (B4) Maximum base moment as a function of μ. (C1–C3) Same data for different values of the radial distance D. (C4) Maximum base moment as a function of D.
Figure 4
Figure 4
Resonant properties of the whisker. (A) The whisker deformation is decomposed into a quasi-static profile Uqs(s, t) and a small amplitude deformation u(s, t) normal to the quasi-static profile. (B) First spatial modes for a whisker in contact at s = ε = 0.1 with boundary conditions V(ε) = V″(ε) = 0. (C) Resonant reduced angular frequency and resonant frequency (double scale) for the first two modes as a function of the contact location ε. (D) First spatial modes for a freely oscillating whisker (V″(ε) = (s4V′)″(ε) = 0).
Figure 5
Figure 5
Shock-induced whisker dynamics. (A) Successive whisker profiles (from dark to light red) plotted at regular time interval (δt = 1.06 ms) following the first whisker/object contact at ε = 0.2. The shock-induced oscillations are visible through the varying density of the profiles. (B) Whisker profiles in the reference frame of the whisker base (δt = 0.2 ms). The distance indicated on each graph corresponds to the displacement of the contact point in μm. (C) Position of the maximal deformation as a function of the time elapsed since the shock (see arrow in B). The dotted line is the best linear fit and corresponds to a velocity 2.54cwave. (D) Time-evolution of the quasi-static κqs(t) (dotted line) and dynamic κdyn(t) (solid line) base moment. (E) Evolution of the time-derivative of the base moment κ˙(t).
Figure 6
Figure 6
Shock-induced mechanical signal at the whisker base. (A) Time-evolution of the quasi-static κqs(t) (dotted line) and dynamic κdyn(t) (solid line) base moment for different contact location (color code). (B) Evolution of the time-derivative of the base moment κ˙(t). (C) Peak amplitude Δκ˙max as a function of the contact location. The inset shows the same data normalized by the quasi-static component κ˙qs(τpeak). (D) Delay τpeak (see arrows on panel B) as a function of the contact location. The dotted line corresponds to the best linear fit, yielding an effective velocity 0.69cwave.
Figure 7
Figure 7
Experimental shock-induced whisker dynamics. (A) Snapshot of the whisker/object initial contact (sampling rate 2.5 kHz) between the vertical bar and the β whisker. The result of the whisker tracking is superimposed (white line) on the frame. The direction of movement of the bar is indicated by an arrow. (B) Whisker profiles in the reference frame of the whisker base (δt = 0.8 ms). The bottom panel is a magnified view of the low amplitude deformation in the top panel. Solid and dotted lines correspond to experimental and theoretical profiles, respectively. (C) Position of the maximal deformation as a function of the time elapsed since the shock (see arrow in B). The gray line is the best linear fit and corresponds to a wave velocity 5.6 m/s. (D) Time-evolution of the experimental (solid line) and predicted (gray line) κ(t) base curvature signal.
Figure 8
Figure 8
Detachment-induced whisker dynamics. (A) Consecutive whisker profiles (δt = 0.6 ms) for different base angle θb at detachment. (B) Dynamic profiles [the quasi-static evolution has been subtracted (δt = 0.2 ms)]. (C) Base moment κ(t) and its time-derivative signals for different base angle at detachment.
Figure 9
Figure 9
Comparison with Hartmann et al. (2003). (A) Figure 1 from Hartmann et al. (2003), showing the whisker vibration driven by the base imposed sinusoidal motion. (B) Resonance curves: the black line is the experimental measurements of the tip to base amplitude ratio reported by Hartmann et al. The blue line is the result of the present calculation.

Similar articles

Cited by

References

    1. Anjum F., Turni H., Mulder P. G. H., van der Burg J., Brecht M. (2006). Tactile guidance of prey capture in etruscan shrews. Proc. Natl. Acad. Sci. U.S.A. 103, 16544–16549 10.1073/pnas.0605573103 - DOI - PMC - PubMed
    1. Arabzadeh E., Panzeri S., Diamond M. E. (2004). Whisker vibration information carried by rat barrel cortex neurons. J. Neurosci. 24, 6011–6020 10.1523/JNEUROSCI.1389-04.2004 - DOI - PMC - PubMed
    1. Arabzadeh E., Zorzin E., Diamond M. E. (2005). Neuronal encoding of texture in the whisker sensory pathway. PLoS. Biol. 3:e17 10.1371/journal.pbio.0030017 - DOI - PMC - PubMed
    1. Audoly B., Neukirch S. (2005). Fragmentation of rods by cascading cracks: why spaghetti does not break in half. Phys. Rev. Lett. 95, 095505 10.1103/PhysRevLett.95.095505 - DOI - PubMed
    1. Berg R. W., Kleinfeld D. (2003). Rhythmic whisking by rat: retraction as well as protraction of the vibrissae is under active muscular control. J. Neurophysiol. 89, 104–117 10.1152/jn.00600.2002 - DOI - PubMed

LinkOut - more resources