. 2012;7(10):e47532.
doi: 10.1371/journal.pone.0047532. Epub 2012 Oct 25.

Analysis of an ordered, comprehensive STM mutant library in infectious Borrelia burgdorferi: insights into the genes required for mouse infectivity

Affiliations

Analysis of an ordered, comprehensive STM mutant library in infectious Borrelia burgdorferi: insights into the genes required for mouse infectivity

Tao Lin et al. PLoS One. 2012.

Abstract

The identification of genes important in the pathogenesis of Lyme disease Borrelia has been hampered by exceedingly low transformation rates in low-passage, infectious organisms. Using the infectious, moderately transformable B. burgdorferi derivative 5A18NP1 and signature-tagged versions of the Himar1 transposon vector pGKT, we have constructed a defined transposon library for the efficient genome-wide investigation of genes required for wild-type pathogenesis, in vitro growth, physiology, morphology, and plasmid replication. To facilitate analysis, the insertion sites of 4,479 transposon mutants were determined by sequencing. The transposon insertions were widely distributed across the entire B. burgdorferi genome, with an average of 2.68 unique insertion sites per kb DNA. The 10 linear plasmids and 9 circular plasmids had insertions in 33 to 100 percent of their predicted genes. In contrast, only 35% of genes in the 910 kb linear chromosome had incapacitating insertions; therefore, the remaining 601 chromosomal genes may represent essential gene candidates. In initial signature-tagged mutagenesis (STM) analyses, 434 mutants were examined at multiple tissue sites for infectivity in mice using a semi-quantitative, Luminex-based DNA detection method. Examples of genes found to be important in mouse infectivity included those involved in motility, chemotaxis, the phosphoenolpyruvate phosphotransferase system, and other transporters, as well as putative plasmid maintenance genes. Availability of this ordered STM library and a high-throughput screening method is expected to lead to efficient assessment of the roles of B. burgdorferi genes in the infectious cycle and pathogenesis of Lyme disease.


Conflict of interest statement

Competing Interests: The authors have declared that no competing interests exist.

Figures

Figure 1
Figure 1. Maps of the STM transposon insertion points in representative plasmids of B. burgdorferi B31 5A18NP1.
The following plasmids are shown: cp26 (Plasmid B, 26,498 bp, 307 transposon mutants, 250 unique sites), lp25 (Plasmid E, 24,177 bp, 102 transposon mutants, 85 unique sites), lp28-1 (Plasmid F, 26,921 bp, 83 transposon mutants, 71 unique sites), lp36 (Plasmid K, 29,766 bp, 224 transposon mutants, 209 unique sites), and lp54 (Plasmid A, 223 transposon mutants, 195 unique sites). Transposon insertion sites are depicted as blue triangles. ORFs that represent apparent pseudogenes or gene fragments are indicated by asterisks after the gene number. Regions that lack transposon insertions are indicated by orange rectangles below each map. A key for the color coding of paralogous gene families commonly associated with the origins of replication of B. burgdorferi plasmids is provided at the bottom of the figure. Maps of the transposon insertion sites for all of the plasmids are provided in Supporting Information, Fig. 3 in File S1.
Figure 2
Figure 2. Luminex-based procedure for detection of STM clones in tissues and in cultures.
A region of the transposon containing the signature tags was first amplified using PCR. The product was treated with Exonuclease I and shrimp alkaline phosphatase to remove unused primers and nucleotides, respectively. An asymmetric primer extension (ASPE) step was then used to simultaneously add a Luminex FlexMAP sequence and label the product with biotinylated dCTP. Streptavidin-phycoerythrin was added to provide the fluorescent signal, and the products were bound to Luminex beads with specific Flexmap capture oligonucleotides and unique fluorescent addresses. Distinct sets of ASPE primers (left side) and corresponding FlexMAP beads were included in the multiplex reaction to specifically detect the presence of each STM clone.
Figure 3
Figure 3. Procedure for high-throughput STM infectivity analysis of B. burgdorferi transposon mutants in this study.
A mixture of 11 STM clones, each with a different signature tag, were inoculated (105/clone i.d.) into two groups of three C3H/HeN mice. Two and four weeks post inoculation (PI), a group of mice were sacrificed and the five tissues indicated were collected. A portion of each tissue was used for direct DNA extraction, whereas another portion was cultured in vitro. Each of the 60 samples was then analyzed using the Luminex STM procedure. The median fluorescence intensity (MFI) obtained for 100 beads for each tag provided a measure of the concentration of each STM-tagged organism in the clone, and results were compared to those obtained with the input pool. Tag 1 and Tag 2 clones represent infectivity-negative (pncA) and -positive (BB0051-) control transposon mutants, respectively.
Figure 4
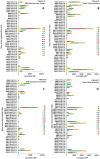
Figure 4. Luminex STM infectivity analysis of B. burgdorferi clones with transposon insertions in 26 of the 29 cp26 genes (bbb01-bbb29).
Results are shown as cumulative MFI for bladder (B), ear (E), heart (H), tibiotarsal joint (J), and inoculation site (skin, S) samples from 3 mice per time point. A and B, 2 weeks PI, C and D, 4 weeks PI. A and C are results from cultured specimens, whereas B and D utilized DNA extracted directly from the tissue specimens. The Y axis indicates the gene number, name, and insertion ratio of each transposon insertion. bbe22 and bb0051 mutants are negative and positive controls, respectively, from the experiments in this analysis. Some mutants were analyzed by the direct DNA extraction method only (e.g. the bbb21 mutant). Independent clones with different insertions in same gene (as indicated by different insertion ratios) were analyzed and some clones were analyzed multiple times in different STM sets to evaluate the reproducibility of results. HP, hypothetical protein; CHP, conserved hypothetical protein; LP, lipoprotein; OMP, outer membrane protein; OSP, outer surface protein.
Figure 5
Figure 5. A simple heat map representation of the mouse infectivity of transposon mutants in cp26 genes.
For each clone, results from Luminex STM analysis (see Fig. 4, Table 3 in File S1) were grouped by week post inoculation (2 weeks or 4 weeks) and by DNA preparation method (Culture  =  use of organisms cultured from tissue; Tissue  =  use of DNA extracted directly from tissue). The data in each group were scored according to the percentage of samples with MFI values above the negative threshold (100) or to the mean MFI value; each result was then color coded as indicated in the key. Each colored box in the figure corresponds to 12 to 15 data points (typically 5 tissues from 3 mice). Heat maps for other plasmids and gene function groups are provided in Figs. S7 and S8. The composite results obtained in all experiments for the positive (bb0051) and negative (pncA) control mutants are provided at the right side of the figure. Abbreviations are as described in the Figure 4 legend.
Figure 6
Figure 6. Transposon mutations in Protein Family (PF) genes postulated to be involved in plasmid maintenance.
PF gene families are listed across the top. Presence of a full-length PF gene of each family is indicated by a colored circle. The plasmid and plasmid-associated PF genes are indicated on the left and right sides, respectively; the PF genes are listed in the same order (left to right) as in the figure. lp28-1 has two PF gene loci. Genes with multiple transposon insertions are marked as XX, whereas those with single mutations have a single X. Genes that have insertions only at the end of the gene are marked by an asterisk; the adjacent number indicates the insertion ratio.

Similar articles

Cited by

References

    1. Steere AC, Coburn J, Glickstein L (2004) The emergence of Lyme disease. J Clin Invest 113: 1093–1101. - PMC - PubMed
    1. Samuels DS, Radolf JD (2010) Borrelia: Molecular Biology, Host Interaction and Pathogenesis. Hethersett, Norwich, UK: Caister Academic Press.
    1. Lane RS, Piesman J, Burgdorfer W (1991) Lyme borreliosis: relation of its causative agent to its vectors and hosts in North America and Europe. Annu Rev Entomol 36: 587–609. - PubMed
    1. Fraser CM, Casjens S, Huang WM, Sutton GG, Clayton R, et al. (1997) Genomic sequence of a Lyme disease spirochaete, Borrelia burgdorferi . Nature 390: 580–586. - PubMed
    1. Casjens S, Palmer N, van Vugt R, Huang WM, Stevenson B, et al. (2000) A bacterial genome in flux: the twelve linear and nine circular extrachromosomal DNAs in an infectious isolate of the Lyme disease spirochete Borrelia burgdorferi . Mol Microbiol 35: 490–516. - PubMed

Publication types

Substances