

Diversity, molecular characterization and expression of T cell receptor γ in a teleost fish, the sea bass (Dicentrarchus labrax, L)
- PMID: 23133531
- PMCID: PMC3485050
- DOI: 10.1371/journal.pone.0047957
Diversity, molecular characterization and expression of T cell receptor γ in a teleost fish, the sea bass (Dicentrarchus labrax, L)
Abstract
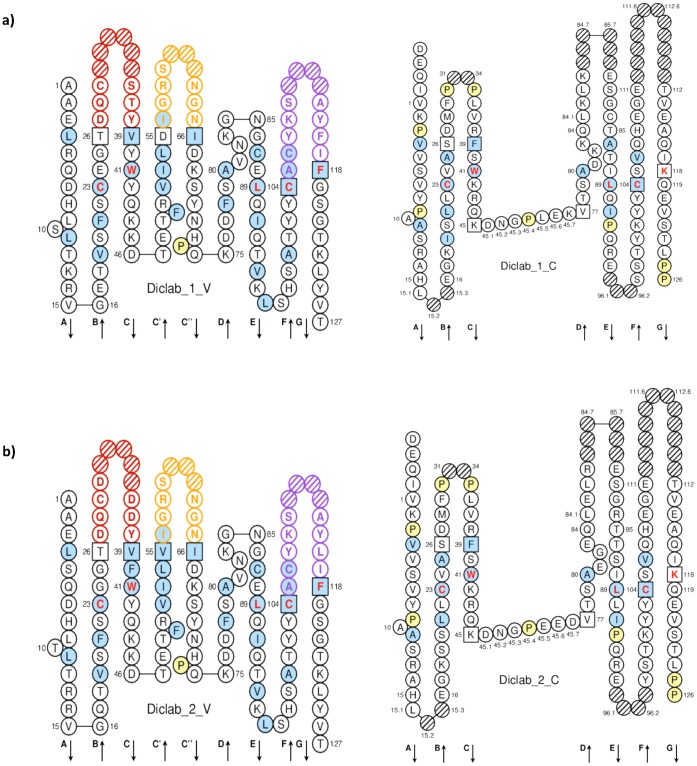
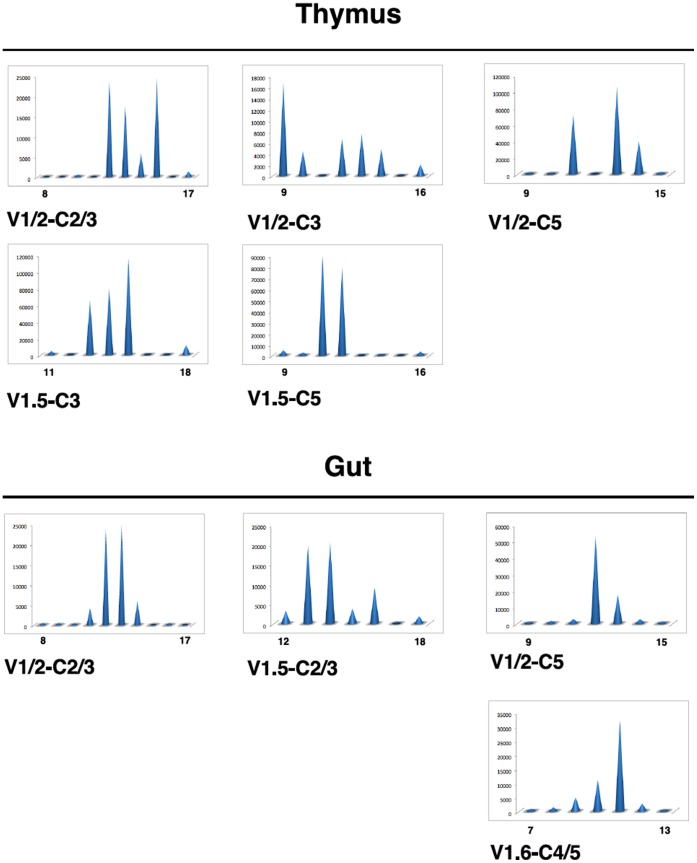
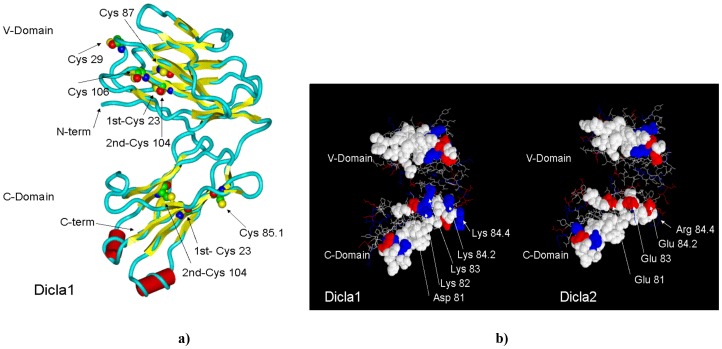
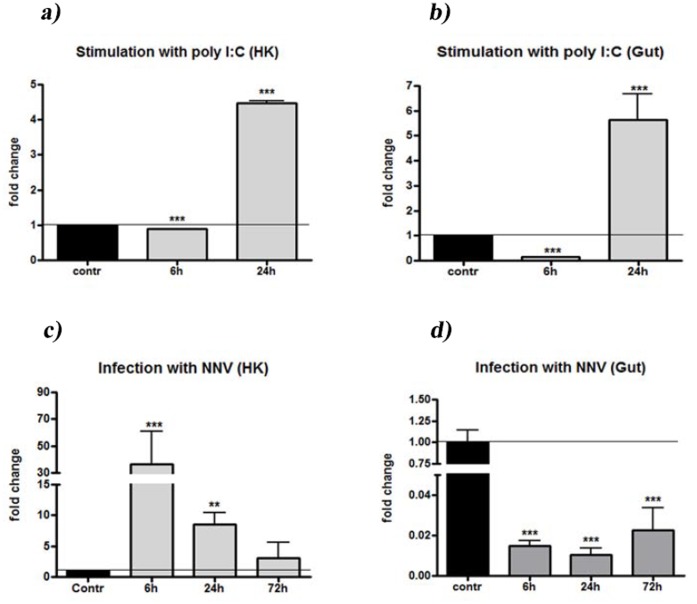
Two lineages of T cells, expressing either the αβ T cell receptor (TR) or the γδ TR, exist in Gnathostomes. The latter type of T cells account for 1-10 % of T cells in blood and up to 30 % in the small intestine. They may recognize unconventional antigens (phosphorylated microbial metabolites, lipid antigens) without the need of major histocompatibility class I (MH1) or class II (MH2) presentation. In this work we have described cloning and structural characterization of TR -chain (TRG) from the teleost Dicentrarchus labrax. Further, by means of quantitative PCR analysis, we analyzed TRG expression levels both in poly I:C stimulated leukocytes in vitro, and following infection with betanodavirus in vivo. Two full length cDNAs relative to TRG, with the highest peptide and nucleotide identity with Japanese flounder, were identified. A multiple alignment analysis showed the conservation of peptides fundamental for TRG biological functions, and of the FGXG motif in the FR4 region, typical of most TR and immunoglobulin light chains. A 3D structure consisting of two domains mainly folded as beta strands with a sandwich architecture for each domain was also reported. TRG CDR3 of 8-18 AA in length and diversity in the TRG rearrangements expressed in thymus and intestine for a given V/C combination were evidenced by junction length spectratyping. TRG mRNA expression levels were high in basal conditions both in thymus and intestine, while in kidney and gut leukocytes they were up-regulated after in vitro stimulation by poly I:C. Finally, in juveniles the TRG expression levels were up-regulated in the head kidney and down-regulated in intestine after in vivo infection with betanodavirus. Overall, in this study the involvement of TRG-bearing T cells during viral stimulation was described for the first time, leading to new insights for the identification of T cell subsets in fish.
Conflict of interest statement
Figures

Similar articles
-
Molecular, Cellular and Functional Analysis of TRγ Chain along the European Sea Bass Dicentrarchus labrax Development.Int J Mol Sci. 2021 Mar 25;22(7):3376. doi: 10.3390/ijms22073376. Int J Mol Sci. 2021. PMID: 33806063 Free PMC article.
-
A CD4 homologue in sea bass (Dicentrarchus labrax): molecular characterization and structural analysis.Mol Immunol. 2008 Jun;45(11):3168-77. doi: 10.1016/j.molimm.2008.02.024. Epub 2008 Apr 9. Mol Immunol. 2008. PMID: 18403019
-
Molecular cloning, differential expression and 3D structural analysis of the MHC class-II beta chain from sea bass (Dicentrarchus labrax L.).Fish Shellfish Immunol. 2007 Oct;23(4):853-66. doi: 10.1016/j.fsi.2007.03.013. Epub 2007 Mar 24. Fish Shellfish Immunol. 2007. PMID: 17493833
-
Transcription of T cell-related genes in teleost fish, and the European sea bass (Dicentrarchus labrax) as a model.Fish Shellfish Immunol. 2011 Nov;31(5):655-62. doi: 10.1016/j.fsi.2010.10.001. Epub 2010 Oct 13. Fish Shellfish Immunol. 2011. PMID: 20950688 Review.
-
Evolution of the T-Cell Receptor (TR) Loci in the Adaptive Immune Response: The Tale of the TRG Locus in Mammals.Genes (Basel). 2020 Jun 5;11(6):624. doi: 10.3390/genes11060624. Genes (Basel). 2020. PMID: 32517024 Free PMC article. Review.
Cited by
-
Transamidation Down-Regulates Intestinal Immunity of Recombinant α-Gliadin in HLA-DQ8 Transgenic Mice.Int J Mol Sci. 2021 Jun 29;22(13):7019. doi: 10.3390/ijms22137019. Int J Mol Sci. 2021. PMID: 34209932 Free PMC article.
-
A Comprehensive Annotation of the Channel Catfish (Ictalurus punctatus) T Cell Receptor Alpha/Delta, Beta, and Gamma Loci.Front Immunol. 2021 Nov 25;12:786402. doi: 10.3389/fimmu.2021.786402. eCollection 2021. Front Immunol. 2021. PMID: 34899754 Free PMC article.
-
Fish Lymphocytes: An Evolutionary Equivalent of Mammalian Innate-Like Lymphocytes?Front Immunol. 2018 May 7;9:971. doi: 10.3389/fimmu.2018.00971. eCollection 2018. Front Immunol. 2018. PMID: 29867952 Free PMC article. Review.
-
The Mucosal Immune System of Teleost Fish.Biology (Basel). 2015 Aug 12;4(3):525-39. doi: 10.3390/biology4030525. Biology (Basel). 2015. PMID: 26274978 Free PMC article. Review.
-
Molecular, Cellular and Functional Analysis of TRγ Chain along the European Sea Bass Dicentrarchus labrax Development.Int J Mol Sci. 2021 Mar 25;22(7):3376. doi: 10.3390/ijms22073376. Int J Mol Sci. 2021. PMID: 33806063 Free PMC article.
References
-
- Raulet DH (1989) The structure, function, and molecular genetics of the γ/δ T cell receptor. Ann. Rev Immunol 7: 175–207. - PubMed
-
- Hass W, Pereira P, Tonegawa S (1993) Gamma/delta cells. Ann Rev Immunol 11: 637–685. - PubMed
-
- Hayday AC (2000) [gamma][delta] cells: a right time and a right place for a conserved third way of protection. Ann Rev Immunol 18: 975–1026. - PubMed
-
- Lefranc M-P, Lefranc G (2001) The T cell receptor FactsBook. Academic Press, London, UK, 1–398.
-
- Allison JP, Havran WL (1991) The immunobiology of T cells with invariant γδ antigen receptors. Ann Rev Immunol 9: 679–705. - PubMed
Publication types
MeSH terms
Substances
LinkOut - more resources
Full Text Sources
