. 2012;7(10):e47988.
doi: 10.1371/journal.pone.0047988. Epub 2012 Oct 25.

TRPA1 is functionally expressed primarily by IB4-binding, non-peptidergic mouse and rat sensory neurons

Affiliations

TRPA1 is functionally expressed primarily by IB4-binding, non-peptidergic mouse and rat sensory neurons

Marie E Barabas et al. PLoS One. 2012.

Abstract

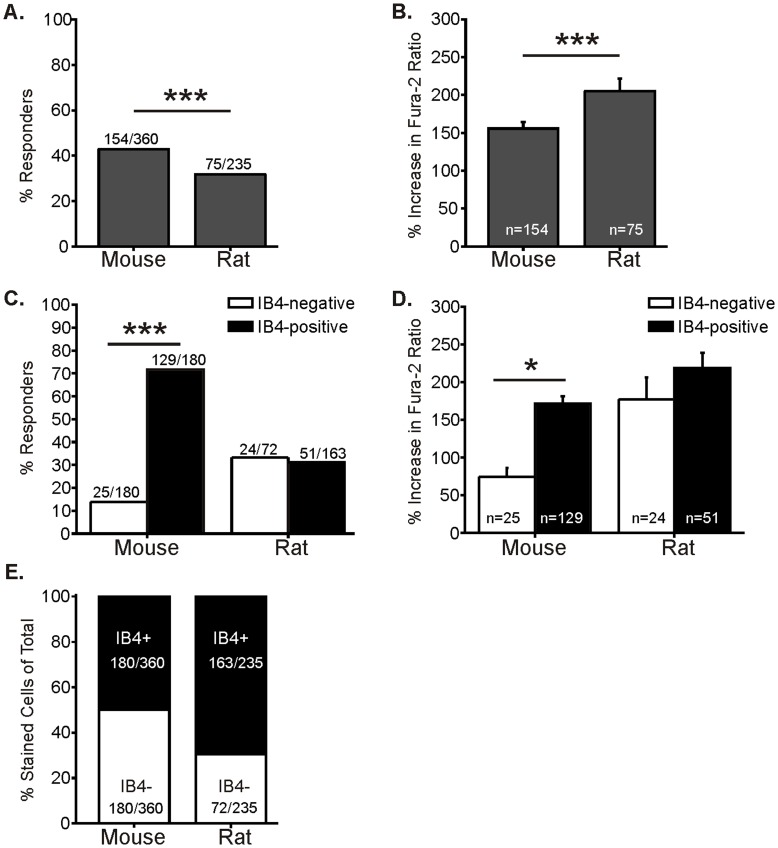
Subpopulations of somatosensory neurons are characterized by functional properties and expression of receptor proteins and surface markers. CGRP expression and IB4-binding are commonly used to define peptidergic and non-peptidergic subpopulations. TRPA1 is a polymodal, plasma membrane ion channel that contributes to mechanical and cold hypersensitivity during tissue injury, making it a key target for pain therapeutics. Some studies have shown that TRPA1 is predominantly expressed by peptidergic sensory neurons, but others indicate that TRPA1 is expressed extensively within non-peptidergic, IB4-binding neurons. We used FURA-2 calcium imaging to define the functional distribution of TRPA1 among peptidergic and non-peptidergic adult mouse (C57BL/6J) DRG neurons. Approximately 80% of all small-diameter (<27 µm) neurons from lumbar 1-6 DRGs that responded to TRPA1 agonists allyl isothiocyanate (AITC; 79%) or cinnamaldehyde (84%) were IB4-positive. Retrograde labeling via plantar hind paw injection of WGA-Alexafluor594 showed similarly that most (81%) cutaneous neurons responding to TRPA1 agonists were IB4-positive. Additionally, we cultured DRG neurons from a novel CGRP-GFP mouse where GFP expression is driven by the CGRPα promoter, enabling identification of CGRP-expressing live neurons. Interestingly, 78% of TRPA1-responsive neurons were CGRP-negative. Co-labeling with IB4 revealed that the majority (66%) of TRPA1 agonist responders were IB4-positive but CGRP-negative. Among TRPA1-null DRGs, few small neurons (2-4%) responded to either TRPA1 agonist, indicating that both cinnamaldehyde and AITC specifically target TRPA1. Additionally, few large neurons (≥27 µm diameter) responded to AITC (6%) or cinnamaldehyde (4%), confirming that most large-diameter somata lack functional TRPA1. Comparison of mouse and rat DRGs showed that the majority of TRPA1-responsive neurons in both species were IB4-positive. Together, these data demonstrate that TRPA1 is functionally expressed primarily in the IB4-positive, CGRP-negative subpopulation of small lumbar DRG neurons from rodents. Thus, IB4 binding is a better indicator than neuropeptides for TRPA1 expression.


Conflict of interest statement

Competing Interests: The authors have declared that no competing interests exist.

Figures

Figure 1
Figure 1. TRPA1 agonists allyl isothiocyante and cinnamaldehyde elicit calcium responses with different latencies in DRG neurons.
A. Representative traces of individual, dissociated lumbar 1–6 dorsal root ganglia (DRG) neurons from C57BL/6J wild-type mice during FURA-2 calcium imaging. Separate neurons were tested with 100 µM allyl isothiocyanate (AITC; 1 min; top trace) or cinnamaldehyde (CINN; 3 min; bottom trace) at 6 ml/min. Note that the latency to peak amplitude for CINN responses was longer than that for AITC, whereas responses to 50 mM K+ (30 s) occurred almost immediately after the start of superfusion. B. Average latency from the start of superfusion to maximum amplitude of response for AITC and CINN (3 culture preparations from 5–6 animals for each group). The latency between onset of superfusion and peak response for CINN was significantly longer than that for AITC (p<0.0001; t-test). C–D. Concentration-response curves for AITC (C) and CINN (D) for percentage of responders (left two panels) and peak amplitude of calcium responses (right panel). Neurons that exhibited a ≥20% increase in FURA ratio from baseline during agonist superfusion were considered “responsive” (3 cultures from 5–6 animals for each group; AITC: 446 total neurons; CINN: 281 total neurons). All neurons were tested with only one concentration of one agonist. For percentage of responders, the EC50 for AITC was 38.5 µM and that for CINN was 60.2 µM (both calculated from 10–1000 µM data). For peak response amplitude, the EC50 for AITC was 115.3 µM (calculated from 10–300 µM data) and that for CINN was 97.5 µM (calculated from 10–1000 µM data).
Figure 2
Figure 2. Cell size distributions of adult mouse and rat DRG neurons responding to TRPA1 agonists.
Distribution of somata diameters (1 µm bins) of lumbar DRG neurons in culture preparations from mouse or rat. Number of neurons responding to AITC or CINN (both 100 µM) are shown in grey bar portion, non-responsive neurons are shown in white bar portion, and total cells in each size bin are reflected by the top of the bar (sum of the grey and white bars). A. Mouse lumbar 1–6 DRG neurons tested with 100 µM AITC (3 cultures from 6 animals; 271 total neurons; 160 responders; 59% responders). B. Mouse lumbar 1–6 DRG neurons tested with 100 µM CINN (7 cultures from 7 animals; 493 total neurons; 160 responders; 32% responders). C. Mouse neurons labeled via retrograde tracer injected into the medial plantar hind paw. All neurons were taken from lumbar 3–5 DRGs ipsilateral to injection. Only labeled neurons were used for recordings. Thus all neurons in the graph were labeled from the hind paw plantar skin. Neurons were tested with 100 µM CINN (5 cultures from 10 animals; 131 total neurons; 43 responders; 33% responders). D. Rat lumbar 1–6 DRG neurons tested with 100 µM CINN (3 cultures from 3 animals; 312 total neurons; 80 responders; 26% responders).
Figure 3
Figure 3. TRPA1 is functionally expressed predominantly by IB4-positive and CGRP-negative neurons.
A. Representative brightfield (left) and FITC (right) images of lumbar 1–6 DRG neurons from C57BL/6J wild-type mouse stained with IB4-FITC (60x objective). IB4-positive neurons were defined by a halo of FITC-labeling around the entire perimeter of the somata of small-diameter (<27 µm) neurons. The red arrow indicates an IB4-positive neuron, whereas the white arrow indicates an IB4-negative neuron. B. Percentage of small-diameter neurons responding to TRPA1 agonists (all 100 µM) defined by IB4-binding or CGRP expression. A greater percentage of IB4-positive neurons responded to TRPA1 agonists than the percentage of IB4-negative neurons (overall effect: Chi square p<0.0001; ***p<0.0001). Likewise, a greater percentage of CGRP-negative neurons responded to CINN than CGRP-positive neurons (*p<0.0350 Fisher’s exact). CGRP data were generated from 3 animals in 2 cultures. C. Amplitude of responses to TRPA1 agonists (all 100 µM) of small-diameter DRG neurons defined by IB4-binding or CGRP expression. IB4-positive neurons responded with a greater peak average amplitude than IB4-negative neurons (overall effect: ANOVA p<0.0001; *p<0.05, Tukey). There was no difference between CGRP-positive and CGRP-negative peak amplitudes.
Figure 4
Figure 4. TRPA1 is functionally expressed mainly by neurons that are both IB4-positive and CGRP-negative.
A. Representative brightfield (left) and FITC (right) images of lumbar 1–6 DRG neurons from the CGRP-GFP+/− mouse strain (20x objective). CGRP-positive neurons were identified by GFP fluorescence levels that were three standard deviations above the average autofluorescence levels of DRG neurons from CGRP-GFP+/+ wild-type mice. The green arrows indicate CGRP-positive neurons. B. Distribution of both CGRP expression and IB4 binding among all small-diameter lumbar 1–6 DRG neurons (248 total neurons). A total of 29% of small neurons were CGRP positive. Note that 50% of these (14.5%) were also IB4-positive. C. Percentage of small diameter neurons responding to 100 µM CINN defined by IB4 and CGRP labeling. A greater percentage of IB4-positive/CGRP-negative neurons responded to CINN than the percentage of responders with other staining combinations (overall effect: Chi square p<0.0001; ***p<0.0001, **p = 0.0019, Fisher’s exact for 2-group comparisons). The majority of responders (66%; 72/109) were IB4-positive and CGRP-negative. D. Amplitude of responses to 100 µM CINN grouped by CGRP and IB4 labeling. The responses of IB4-positive/CGRP-positive were significantly greater than those for IB4-negative/CGRP-negative neurons (overall effect: ANOVA p = 0.0250; *p<0.05 Tukey post hoc test).
Figure 5
Figure 5. The pattern of functional TRPA1 expression differs between mouse and rat DRG neurons.
A. Percentage of small-diameter mouse and rat DRG neurons responding to 100 µM CINN. Small-diameter neurons for mouse were defined as less than 27 µm, whereas those for rat were defined as less than 30 µm in soma diameter. Significantly more small-diameter mouse neurons responded to CINN than rat neurons (***p = 0.0096, Fisher’s exact). B. Peak amplitude of responses for mouse and rat small-diameter neurons to 100 µM CINN. Rat neurons had a greater response amplitude to CINN than did mouse neurons (***p = 0.0039, t-test). C. Percentage of mouse and rat neurons responding to 100 µM CINN defined by IB4 staining. For mouse, significantly more IB4-positive neurons responded than IB4-negative neurons (left bars). However, for rat there was no difference between IB4-positive and IB4-negative neurons (overall effect: Chi square p<0.0001; ***p<0.0001, Fisher’s exact). Nonetheless, among the rat neurons that responded to CINN, the majority were IB4-positive (68%; 51/75). The mouse data set (left two bars) is the same data as previously shown in Fig 3B (middle two bars). D. Amplitude of responses to 100 µM CINN of mouse and rat neurons defined by IB4 binding. In mouse, the IB4-positive neurons responded with greater amplitudes than IB4-negative neurons. In contrast to mouse, there was no difference between the amplitudes of IB4-positive and IB4-negative neurons from rat (overall effect: ANOVA p<0.0001; *p<0.01, Tukey post hoc test). The mouse data (left two bars) is the same as shown in Fig 3C (middle two bars). E. Distribution of IB4 binding among all small-diameter neurons from mouse and rat. Significantly more neurons were IB4-positive in rat than in mouse (p<0.0001, Fisher’s exact).
Figure 6
Figure 6. TRPA1 function in IB4-positive neurons increases with duration in culture.
A. Percentage of small-diameter L1-6 DRG neurons from adult mouse responding to 100 µM CINN defined by IB4 binding and duration between plating and imaging cells (5–7 cultures prepared from 5–7 animals). The percentage of IB4-positive responders significantly increased between the 4.5–8.5 hr and the 10.5–14.5 hr time points after plating (overall effect: Chi square p<0.0001; ***p<0.0001, Fisher’s exact). At the earliest time point tested (4.5–8.5 hrs), although there was a smaller percentage of IB4-positive neurons responding to CINN than at the later time points, there were still significantly more IB4-positive than IB4-negative neurons responding at this time (**p = 0.0005, Fisher’s exact). In contrast, there was no difference in IB4-negative responders across any of the time points. The data set for 18–24 hrs (right two bars) is the same as that shown in Fig 3B (middle two bars). B. Average amplitude of responses to 100 µM CINN defined by IB4 binding and duration between plating and imaging neurons. The amplitude of responses for IB4-positive neurons increases between 8.5 and 18 hrs (overall effect: ANOVA p<0.0001; *p<0.05, Tukey post hoc test). There was no overall difference in the amplitude of responses for IB4-negative responders. C. Distribution of IB4 staining among all small-diameter neurons defined by duration between plating and imaging cells. There was no significant change in IB4 binding across any of the time points tested (Chi square p = 0.0735). The data set for 18–23 hrs (right bar) is the same as shown in Fig 5E (left bar).

References

    1. Lawson SN, Perry MJ, Prabhakar E, McCarthy PW (1993) Primary sensory neurones: neurofilament, neuropeptides, and conduction velocity. Brain Res Bull 30: 239–243. - PubMed
    1. Stucky CL, Lewin GR (1999) Isolectin B(4)-positive and -negative nociceptors are functionally distinct. J Neurosci 19: 6497–6505. - PMC - PubMed
    1. Bennett DL, Dmietrieva N, Priestley JV, Clary D, McMahon SB (1996) trkA, CGRP and IB4 expression in retrogradely labelled cutaneous and visceral primary sensory neurones in the rat. Neurosci Lett 206: 33–36. - PubMed
    1. Dirajlal S, Pauers LE, Stucky CL (2003) Differential response properties of IB(4)-positive and -negative unmyelinated sensory neurons to protons and capsaicin. J Neurophysiol 89: 513–524. - PubMed
    1. Lawson SN, Waddell PJ (1991) Soma neurofilament immunoreactivity is related to cell size and fibre conduction velocity in rat primary sensory neurons. J Physiol 435: 41–63. - PMC - PubMed

Publication types

MeSH terms