. 2012;7(10):e48086.
doi: 10.1371/journal.pone.0048086. Epub 2012 Oct 25.

Modulation of the osteosarcoma expression phenotype by microRNAs

Affiliations

Modulation of the osteosarcoma expression phenotype by microRNAs

Heidi M Namløs et al. PLoS One. 2012.

Abstract

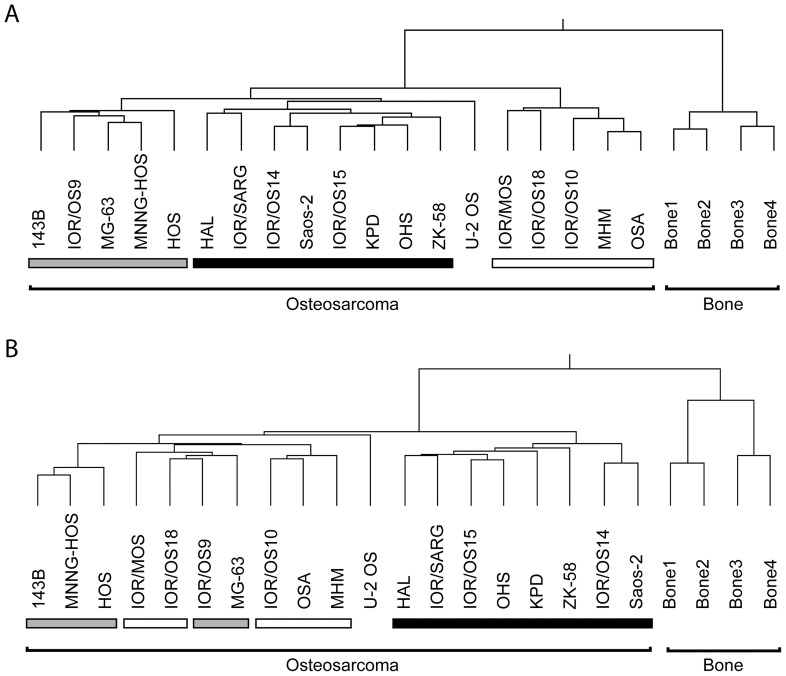
Background: Osteosarcomas are the most common primary malignant tumors of bone and show multiple and complex genomic aberrations. miRNAs are non-coding RNAs capable of regulating gene expression at the post transcriptional level, and miRNAs and their target genes may represent novel therapeutic targets or biomarkers for osteosarcoma. In order to investigate the involvement of miRNAs in osteosarcoma development, global microarray analyses of a panel of 19 human osteosarcoma cell lines was performed.

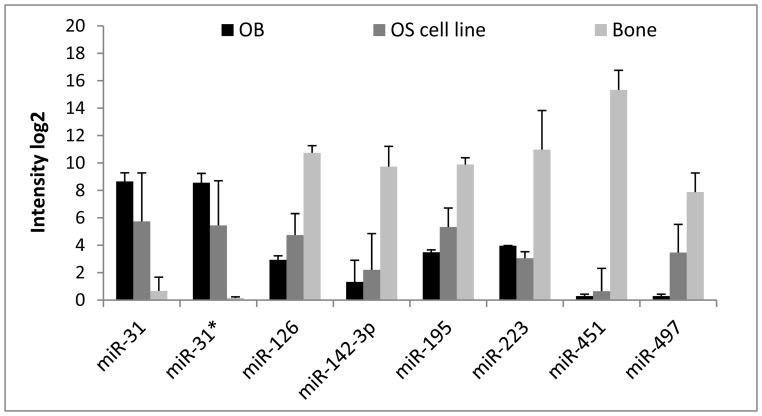
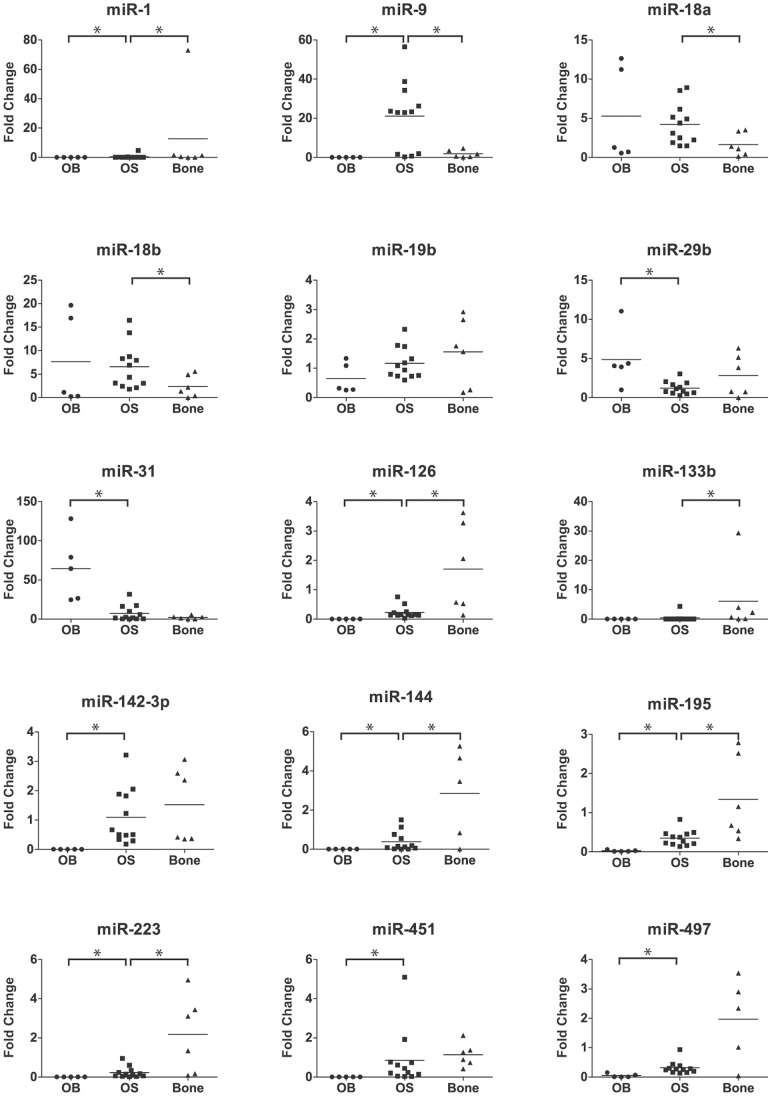
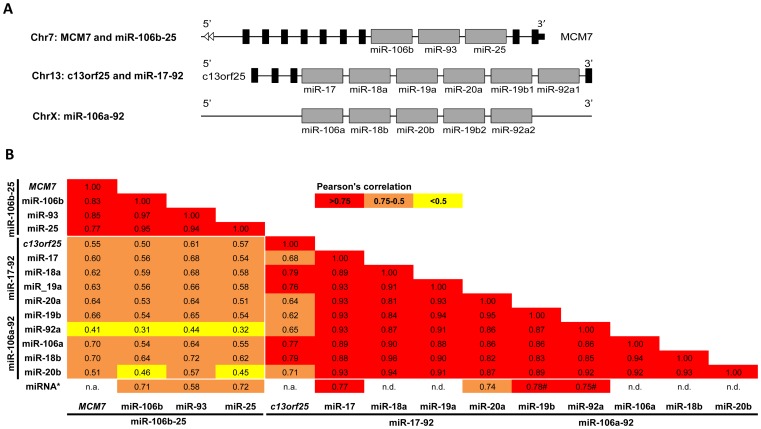
Principal findings: We identified 177 miRNAs that were differentially expressed in osteosarcoma cell lines relative to normal bone. Among these, miR-126/miR-126*, miR-142-3p, miR-150, miR-223, miR-486-5p and members of the miR-1/miR-133a, miR-144/miR-451, miR-195/miR-497 and miR-206/miR-133b clusters were found to be downregulated in osteosarcoma cell lines. All miRNAs in the paralogous clusters miR-17-92, miR-106b-25 and miR-106a-92 were overexpressed. Furthermore, the upregulated miRNAs included miR-9/miR-9*, miR-21*, miR-31/miR-31*, miR-196a/miR-196b, miR-374a and members of the miR-29 and miR-130/301 families. The most interesting inversely correlated miRNA/mRNA pairs in osteosarcoma cell lines included miR-9/TGFBR2 and miR-29/p85α regulatory subunit of PI3K. PTEN mRNA correlated inversely with miR-92a and members of the miR-17 and miR-130/301 families. Expression profiles of selected miRNAs were confirmed in clinical samples. A set of miRNAs, miR-1, miR-18a, miR-18b, miR-19b, miR-31, miR-126, miR-142-3p, miR-133b, miR-144, miR-195, miR-223, miR-451 and miR-497 was identified with an intermediate expression level in osteosarcoma clinical samples compared to osteoblasts and bone, which may reflect the differentiation level of osteosarcoma relative to the undifferentiated osteoblast and fully differentiated normal bone.

Significance: This study provides an integrated analysis of miRNA and mRNA in osteosarcoma, and gives new insight into the complex genetic mechanisms of osteosarcoma development and progression.


Conflict of interest statement

Competing Interests: The authors have declared that no competing interests exist.

Figures

Figure 1
Figure 1. Unsupervised hierarchical clustering of 19 osteosarcoma (OS) cell lines and four normal bone samples. A
. 361 miRNAs expressed in at least 75% of the bone samples and/or 25% of the osteosarcoma cell lines. B: Expression of the 48,701 mRNA probes. Distance metric: Pearson’s correlation absolute average. Bars under cell lines indicate samples with similar expression profile in miRNA (A) and mRNA (B) data.
Figure 2
Figure 2. miRNA microarray expression levels in osteosarcoma cell lines, normal bone and osteoblasts.
The expression level is shown as a mean for each group of samples; two osteoblast primary cultures, 19 osteosarcoma cell lines and four bones. OS: osteosarcoma; STDEV: standard deviation.
Figure 3
Figure 3. Verification of expression levels of miRNAs in osteosarcoma clinical samples, normal bone and osteoblasts.
Scatter plot showing the expression level of 15 miRNAs, generated from qRT-PCR data. The expression values are relative to the mean expression level of bone samples. *: p-value <0.05; vertical line: mean value.
Figure 4
Figure 4. Genomic organization and Pearson’s correlation of miR-106b-25, miR-17-92, miR-106a-92 and mRNA host genes MCM7 and c13orf25.
A. Schematic illustration of the genomic organization of miRNA clusters and host genes. MCM7 and miR-106b-25 are located on 7q22.1, c13orf25 and miR-17-92 are located on 13q31.2 and the miR-106a-92 cluster on Xq26.2. Black and grey boxes indicate exons and miRNAs, respectively, not in scale. B. Pearson’s correlation between the miRNAs of the miR-106b-25, miR-17-92 and miR-106a-92 clusters and the host genes MCM7 and c13orf25. miR-17-92 and miR-106a-92 contains common mature miRNAs, hence the two clusters are not separated. miRNA* represents the correlation between the miRNA of the first strand and the second strand of the hairpin, ex between miR-17 and miR-17*. The values are colour-coded according to Pearson’s correlation in cell lines. #: Pearson’s correlation only calculated for miR-19b-1* and miR-92a-1* since miR-19b-2* and miR-92a-2* were not detected. n.d.: miRNA not detected in most of the samples due to low expression levels.

Similar articles

Cited by

References

    1. Friedman RC, Farh KK, Burge CB, Bartel DP (2009) Most mammalian mRNAs are conserved targets of microRNAs. Genome Res 19: 92–105. - PMC - PubMed
    1. Bartel DP (2009) MicroRNAs: target recognition and regulatory functions. Cell 136: 215–233. - PMC - PubMed
    1. Subramanian S, Lui WO, Lee CH, Espinosa I, Nielsen TO, et al. (2007) MicroRNA expression signature of human sarcomas. Oncogene 27: 2015–2026. - PubMed
    1. Lu J, Getz G, Miska EA, Alvarez-Saavedra E, Lamb J, et al. (2005) MicroRNA expression profiles classify human cancers. Nature 435: 834–838. - PubMed
    1. Volinia S, Calin GA, Liu CG, Ambs S, Cimmino A, et al. (2006) A microRNA expression signature of human solid tumors defines cancer gene targets. Proc Natl Acad Sci U S A 103: 2257–2261. - PMC - PubMed

Publication types