

Diabetic HDL is dysfunctional in stimulating endothelial cell migration and proliferation due to down regulation of SR-BI expression
- PMID: 23133640
- PMCID: PMC3487724
- DOI: 10.1371/journal.pone.0048530
Diabetic HDL is dysfunctional in stimulating endothelial cell migration and proliferation due to down regulation of SR-BI expression
Abstract
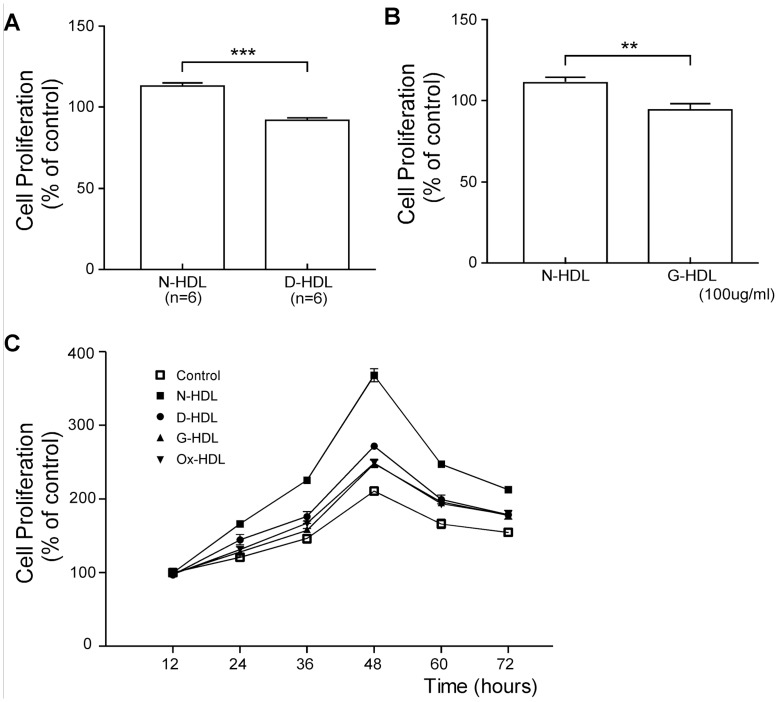
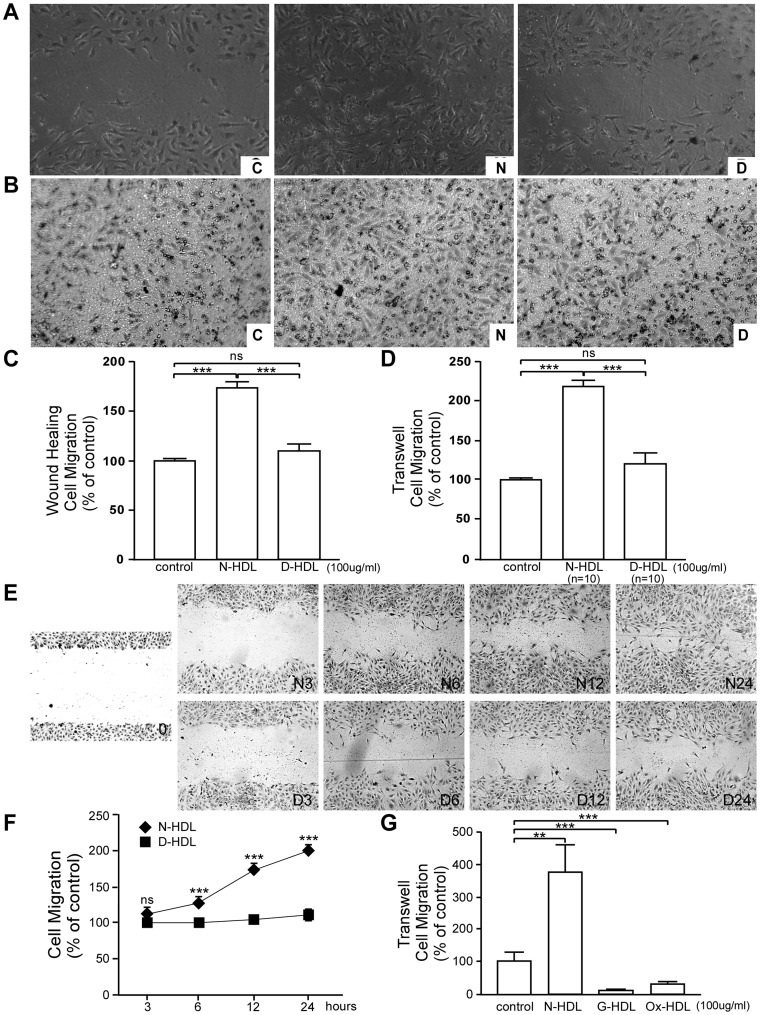
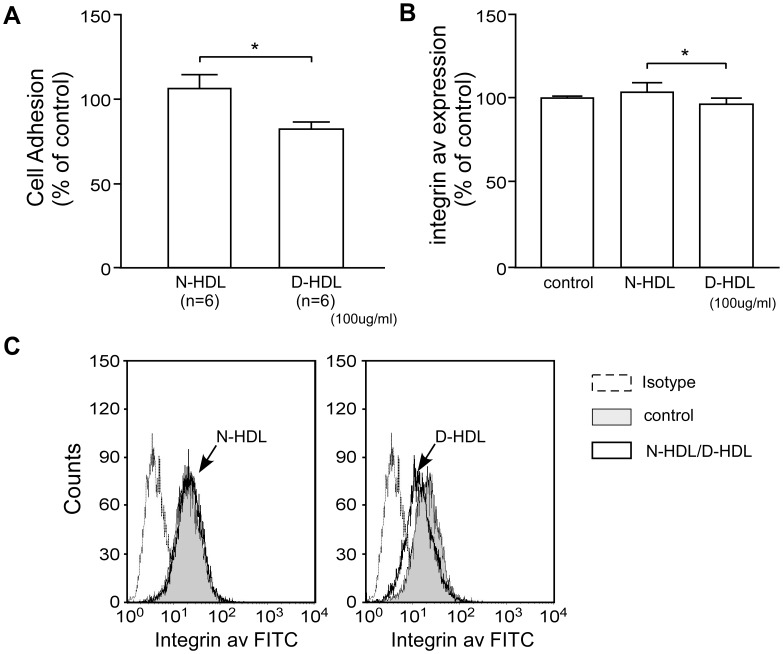
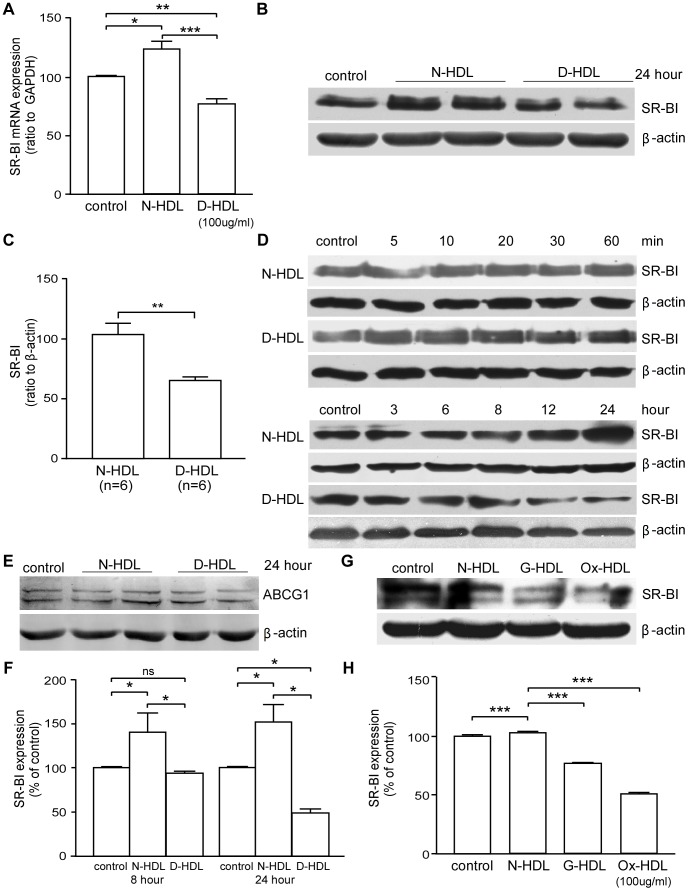
Background: Diabetic HDL had diminished capacity to stimulate endothelial cell (EC) proliferation, migration, and adhesion to extracellular matrix. The mechanism of such dysfunction is poorly understood and we therefore sought to determine the mechanistic features of diabetic HDL dysfunction.
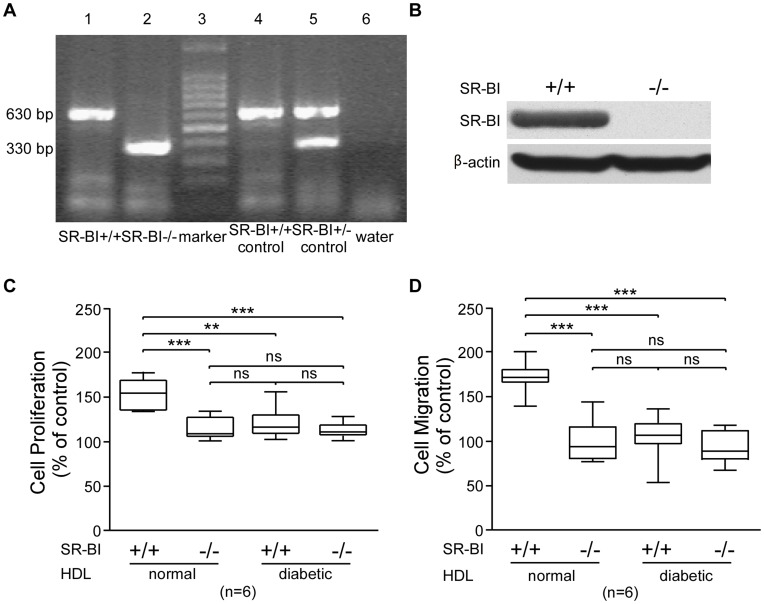
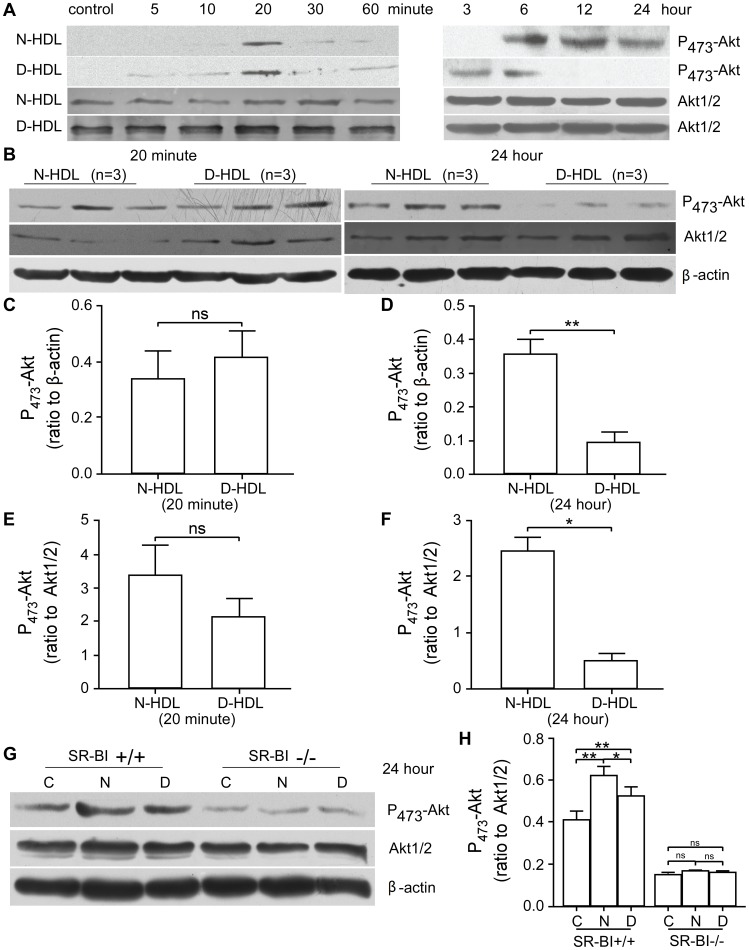
Methodology/principal findings: We found that the dysfunction of diabetic HDL on human umbilical vein endothelial cells (HUVECs) was associated with the down regulation of the HDL receptor protein, SR-BI. Akt-phosphorylation in HUVECs was induced in a biphasic manner by normal HDL. While diabetic HDL induced Akt phosphorylation normally after 20 minutes, the phosphorylation observed 24 hours after diabetic HDL treatment was reduced. To determine the role of SR-BI down regulation on diminished EC responses of diabetic HDL, Mouse aortic endothelial cells (MAECs) were isolated from wild type and SR-BI (-/-) mice, and treated with normal and diabetic HDL. The proliferative and migratory effects of normal HDL on wild type MAECs were greatly diminished in SR-BI (-/-) cells. In contrast, response to diabetic HDL was impaired in both types suggesting diminished effectiveness of diabetic HDL on EC proliferation and migration might be due to the down regulation of SR-BI. Additionally, SR-BI down regulation diminishes diabetic HDL's capacity to activate Akt chronically.
Conclusions/significance: Diabetic HDL was dysfunctional in promoting EC proliferation, migration, and adhesion to matrix which was associated with the down-regulation of SR-BI. Additionally, SR-BI down regulation diminishes diabetic HDL's capacity to activate Akt chronically.
Conflict of interest statement
Figures
Similar articles
-
HDL in diabetic nephropathy has less effect in endothelial repairing than diabetes without complications.Lipids Health Dis. 2016 Apr 14;15:76. doi: 10.1186/s12944-016-0246-z. Lipids Health Dis. 2016. PMID: 27074994 Free PMC article.
-
Protein markers of dysfunctional HDL in scavenger receptor class B type I deficient mice.J Transl Med. 2018 Jun 7;16(1):155. doi: 10.1186/s12967-018-1502-y. J Transl Med. 2018. PMID: 29879989 Free PMC article.
-
Apolipoprotein A-1 mimetic peptide 4F promotes endothelial repairing and compromises reendothelialization impaired by oxidized HDL through SR-B1.Redox Biol. 2018 May;15:228-242. doi: 10.1016/j.redox.2017.11.027. Epub 2017 Dec 8. Redox Biol. 2018. PMID: 29277016 Free PMC article.
-
Effects of diabetic HDL on endothelial cell function.Cardiovasc Hematol Disord Drug Targets. 2014;14(2):137-41. doi: 10.2174/1871529x14666140505124415. Cardiovasc Hematol Disord Drug Targets. 2014. PMID: 24801724 Review.
-
The Endothelium Is Both a Target and a Barrier of HDL's Protective Functions.Cells. 2021 Apr 28;10(5):1041. doi: 10.3390/cells10051041. Cells. 2021. PMID: 33924941 Free PMC article. Review.
Cited by
-
Feedback inhibition of CREB signaling by p38 MAPK contributes to the negative regulation of steroidogenesis.Reprod Biol Endocrinol. 2017 Mar 16;15(1):19. doi: 10.1186/s12958-017-0239-4. Reprod Biol Endocrinol. 2017. PMID: 28302174 Free PMC article.
-
HDL in diabetic nephropathy has less effect in endothelial repairing than diabetes without complications.Lipids Health Dis. 2016 Apr 14;15:76. doi: 10.1186/s12944-016-0246-z. Lipids Health Dis. 2016. PMID: 27074994 Free PMC article.
-
Susceptibility gene for stroke or cerebral infarction in the Han population in Hunan Province of China.Neural Regen Res. 2013 Jun 5;8(16):1519-27. doi: 10.3969/j.issn.1673-5374.2013.16.009. Neural Regen Res. 2013. PMID: 25206448 Free PMC article.
-
Treatment with the herbal medicine, naoxintong improves the protective effect of high-density lipoproteins on endothelial function in patients with type 2 diabetes.Mol Med Rep. 2016 Mar;13(3):2007-16. doi: 10.3892/mmr.2016.4792. Epub 2016 Jan 18. Mol Med Rep. 2016. PMID: 26781332 Free PMC article. Clinical Trial.
-
Insights into the molecular mechanisms of diabetes-induced endothelial dysfunction: focus on oxidative stress and endothelial progenitor cells.Endocrine. 2015 Dec;50(3):537-67. doi: 10.1007/s12020-015-0709-4. Epub 2015 Aug 14. Endocrine. 2015. PMID: 26271514
References
-
- Taskinen MR (2003) Diabetic dyslipidaemia: from basic research to clinical practice. Diabetologia 46: 733–749. - PubMed
-
- Barter P, Gotto AM, LaRosa JC, Maroni J, Szarek M, et al. (2007) HDL cholesterol, very low levels of LDL cholesterol, and cardiovascular events. New England Journal of Medicine 357: 1301–1310. - PubMed
-
- Terasaka N, Wang N, Yvan-Charvet L, Tall AR (2007) High-density lipoprotein protects macrophages from oxidized low-density lipoprotein-induced apoptosis by promoting efflux of 7-ketocholesterol via ABCG1. Proceedings of the National Academy of Sciences of the United States of America 104: 15093–15098. - PMC - PubMed
-
- Zhu W, Saddar S, Seetharam D, Chambliss KL, Longoria C, et al. (2008) The scavenger receptor class B type I adaptor protein PDZK1 maintains endothelial monolayer integrity. Circ Res 102: 480–487. - PubMed
Publication types
MeSH terms
Substances
Grants and funding
LinkOut - more resources
Full Text Sources
Medical
Molecular Biology Databases
Research Materials
